> ## Documentation Index
> Fetch the complete documentation index at: https://help.fieldpulse.com/llms.txt
> Use this file to discover all available pages before exploring further.
# How to Create Project Reports
> Build a project report in FieldPulse to see which multi-job projects have stalled, compare workloads across teams, and check completion percentage.
> **Who uses this:** Admins have full reporting access, and Team Managers can be given it. Service Agents and Limited Agents do not have reporting access. **Availability:** All regions.
A project report is built from the **Projects** tab in raw data reporting, and it pulls your project records — status, completion percentage, assigned teams, and estimate and invoice totals — into one table over the date range you choose.
## Overview
A project report shows where each project stands across your pipeline. Use it to sort projects by status, group them by assigned team to compare workloads, and see how far along each project is. The most common versions are projects by status, projects by tag, and projects by assigned team.
Building a project report follows the same path as every other raw data report — set a date range, choose the columns, set the filters, then read the table. Project reporting is part of [FieldPulse's dashboards and reporting](https://www.fieldpulse.com/features/dashboards-and-reporting). For the parts of the reporting flow that are the same on every record type — saving a report, adding it to your dashboard, and exporting to CSV — see [How to Use Raw Data Reporting](/reporting/raw-data/using-raw-data-reporting).
## Video walkthrough
## Before you begin
* Create the projects you want to report on. See [Project Management Overview](/jobs/projects/overview).
* Check that your role has reporting access. An Admin has full reporting access; a Team Manager needs **Full Reporting access** turned on.
## Set the date range
1. Select **Reporting** under the **Management** tab in the left-side menu.
2. Select the **Projects** tab, then select **Raw Data**.
3. Select the calendar icon and choose the start date range you want to report on.
4. Select **Load Data**.
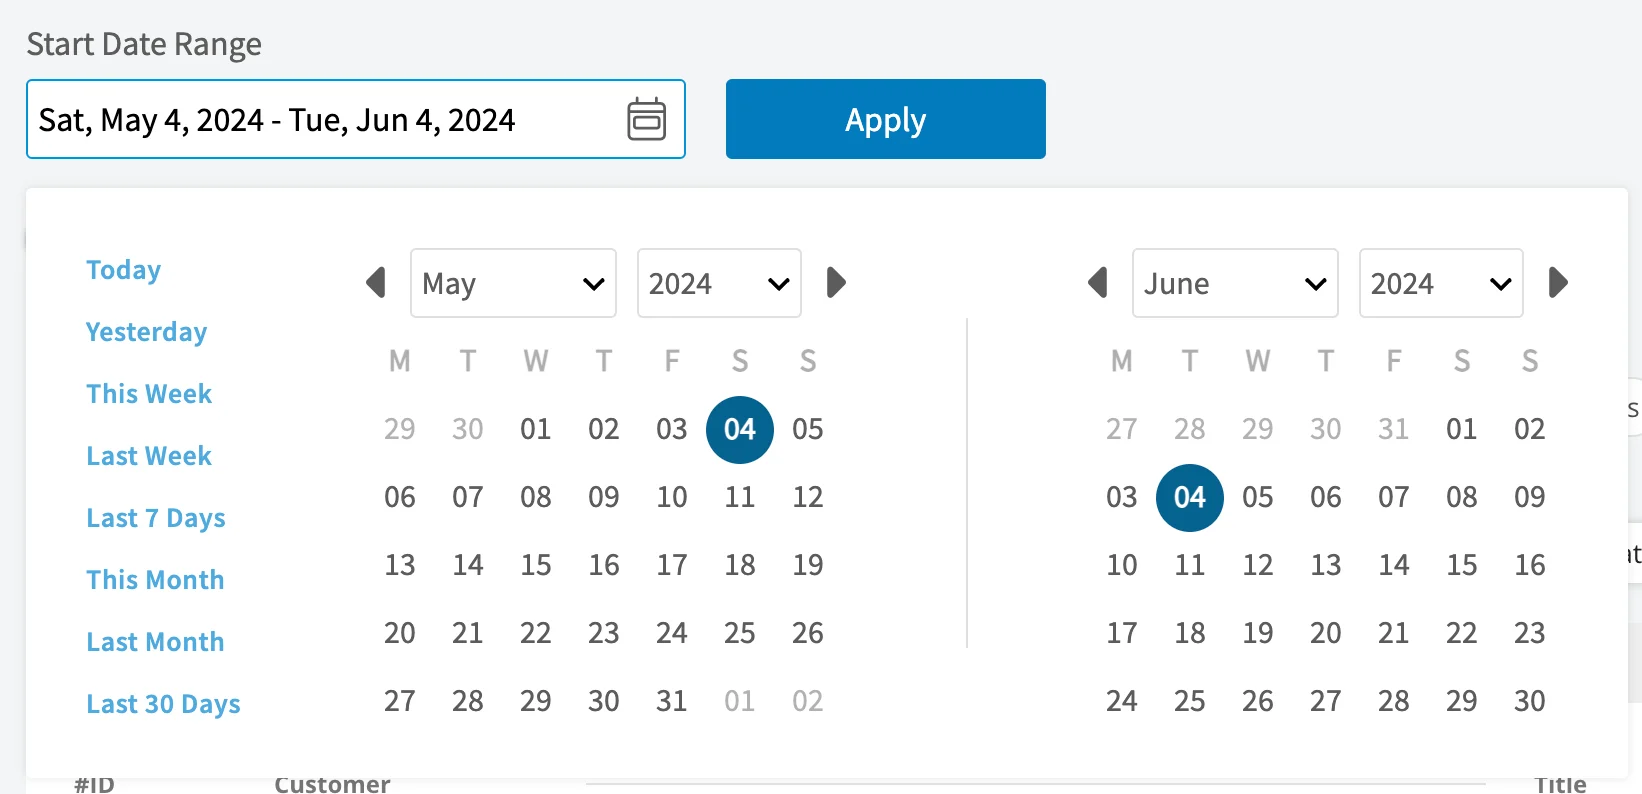 The calendar offers these presets:
| **Preset** | **Date range** |
| ---------------- | ------------------------------------------------- |
| **Today** | 12:00 AM to the current time |
| **Yesterday** | The previous day, 12:00 AM to 11:59 PM |
| **This Week** | Monday through Sunday of the current week |
| **Last Week** | The previous week |
| **Last 7 Days** | The previous seven days, including today |
| **This Month** | The first of the current month to the current day |
| **Last Month** | The entire month before the current month |
| **Last 30 Days** | The previous 30 days, including today |
| **Custom** | Start and end dates you select on the calendar |
## Choose your columns
Select **Columns** to choose which project fields appear in the report table and the order they appear in.
The calendar offers these presets:
| **Preset** | **Date range** |
| ---------------- | ------------------------------------------------- |
| **Today** | 12:00 AM to the current time |
| **Yesterday** | The previous day, 12:00 AM to 11:59 PM |
| **This Week** | Monday through Sunday of the current week |
| **Last Week** | The previous week |
| **Last 7 Days** | The previous seven days, including today |
| **This Month** | The first of the current month to the current day |
| **Last Month** | The entire month before the current month |
| **Last 30 Days** | The previous 30 days, including today |
| **Custom** | Start and end dates you select on the calendar |
## Choose your columns
Select **Columns** to choose which project fields appear in the report table and the order they appear in.
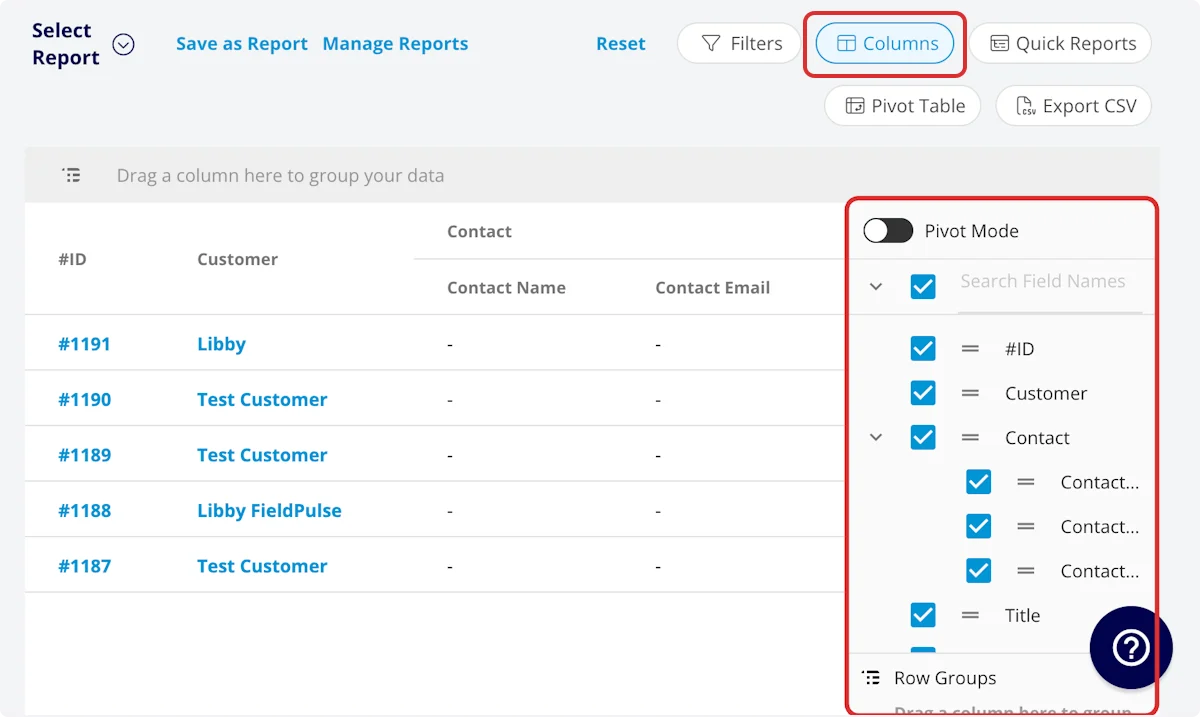 The project report includes these columns by default:
| **Column** | **What it holds** |
| -------------------------------------------------------- | ------------------------------------------------------------------------- |
| **#ID** | The project number |
| **Name** | The project title |
| **Status** | The project workflow status |
| **Customer** | The customer linked to the project record |
| **Location** | The service location for the project |
| **Created At** | The date and time the project record was created |
| **Created By** | The author of the project record |
| **Job Notes** | Notes on related job records |
| **Notes** | Notes on the project record |
| **Description** | The project description |
| **Start Time** | The date and time the project was scheduled to begin |
| **End Time** | The date and time the project was scheduled to end |
| **Clock In Date/Time** | The clock-in date and time |
| **Clock Out Date/Time** | The clock-out date and time |
| **Completion Percentage** | The project completion percentage |
| **Assigned Teams** | The team assigned to the project |
| **Custom Fields** | User-created fields related to the project record |
| **Customer — Custom Fields** | User-created fields related to the customer record |
| **Customer — Customer Phone** | The customer's primary phone number |
| **Customer — Customer Email** | The customer's primary email address |
| **Customer — Customer Phone 2** | The customer's secondary phone number |
| **Customer — Customer Email 2** | The customer's secondary email address |
| **Customer — Customer Assigned To** | The user assigned to the customer record |
| **Customer — Customer Lead Source** | The lead source on the customer record |
| **Customer — Customer Pipeline Status** | The customer's custom sales pipeline status |
| **Customer — Customer Next Steps** | Next steps listed on the custom sales pipeline |
| **Customer — Customer Notes** | Notes on the customer record |
| **Customer — Customer Job Notes** | Job notes on the customer record, automatically inserted onto job records |
| **Customer — Customer Created Date** | The date and time the customer was added to FieldPulse |
| **Customer — Customer Tags** | Tags attached to the customer record |
| **Estimates — Accepted Estimates Total (Pre-Tax)** | Total amount on the estimate before tax |
| **Estimates — Accepted Estimates Total Tax Amount** | Total amount on the estimate |
| **Related Estimates** | Record numbers for estimates linked to the project |
| **Total Invoice Pre-Tax Subtotal** | The dollar amount of the invoice before tax |
| **Related Invoice** | The invoice linked to the project |
| **Related Purchase Orders — Name** | The purchase order title |
| **Related Purchase Orders — Related PO Item** | Filter by item name |
| **Job Status Workflow — Current Total Time in Status** | Recorded in HH:MM:SS |
| **Job Status Workflow — Completed Total Time in Status** | Recorded in HH:MM:SS |
**Job Status Workflow** includes each status in your custom status workflow.
## Set your filters
Before running the report, set filters to narrow the results. Select the **Filters** icon, then choose how you want to filter the report.
The project report includes these columns by default:
| **Column** | **What it holds** |
| -------------------------------------------------------- | ------------------------------------------------------------------------- |
| **#ID** | The project number |
| **Name** | The project title |
| **Status** | The project workflow status |
| **Customer** | The customer linked to the project record |
| **Location** | The service location for the project |
| **Created At** | The date and time the project record was created |
| **Created By** | The author of the project record |
| **Job Notes** | Notes on related job records |
| **Notes** | Notes on the project record |
| **Description** | The project description |
| **Start Time** | The date and time the project was scheduled to begin |
| **End Time** | The date and time the project was scheduled to end |
| **Clock In Date/Time** | The clock-in date and time |
| **Clock Out Date/Time** | The clock-out date and time |
| **Completion Percentage** | The project completion percentage |
| **Assigned Teams** | The team assigned to the project |
| **Custom Fields** | User-created fields related to the project record |
| **Customer — Custom Fields** | User-created fields related to the customer record |
| **Customer — Customer Phone** | The customer's primary phone number |
| **Customer — Customer Email** | The customer's primary email address |
| **Customer — Customer Phone 2** | The customer's secondary phone number |
| **Customer — Customer Email 2** | The customer's secondary email address |
| **Customer — Customer Assigned To** | The user assigned to the customer record |
| **Customer — Customer Lead Source** | The lead source on the customer record |
| **Customer — Customer Pipeline Status** | The customer's custom sales pipeline status |
| **Customer — Customer Next Steps** | Next steps listed on the custom sales pipeline |
| **Customer — Customer Notes** | Notes on the customer record |
| **Customer — Customer Job Notes** | Job notes on the customer record, automatically inserted onto job records |
| **Customer — Customer Created Date** | The date and time the customer was added to FieldPulse |
| **Customer — Customer Tags** | Tags attached to the customer record |
| **Estimates — Accepted Estimates Total (Pre-Tax)** | Total amount on the estimate before tax |
| **Estimates — Accepted Estimates Total Tax Amount** | Total amount on the estimate |
| **Related Estimates** | Record numbers for estimates linked to the project |
| **Total Invoice Pre-Tax Subtotal** | The dollar amount of the invoice before tax |
| **Related Invoice** | The invoice linked to the project |
| **Related Purchase Orders — Name** | The purchase order title |
| **Related Purchase Orders — Related PO Item** | Filter by item name |
| **Job Status Workflow — Current Total Time in Status** | Recorded in HH:MM:SS |
| **Job Status Workflow — Completed Total Time in Status** | Recorded in HH:MM:SS |
**Job Status Workflow** includes each status in your custom status workflow.
## Set your filters
Before running the report, set filters to narrow the results. Select the **Filters** icon, then choose how you want to filter the report.
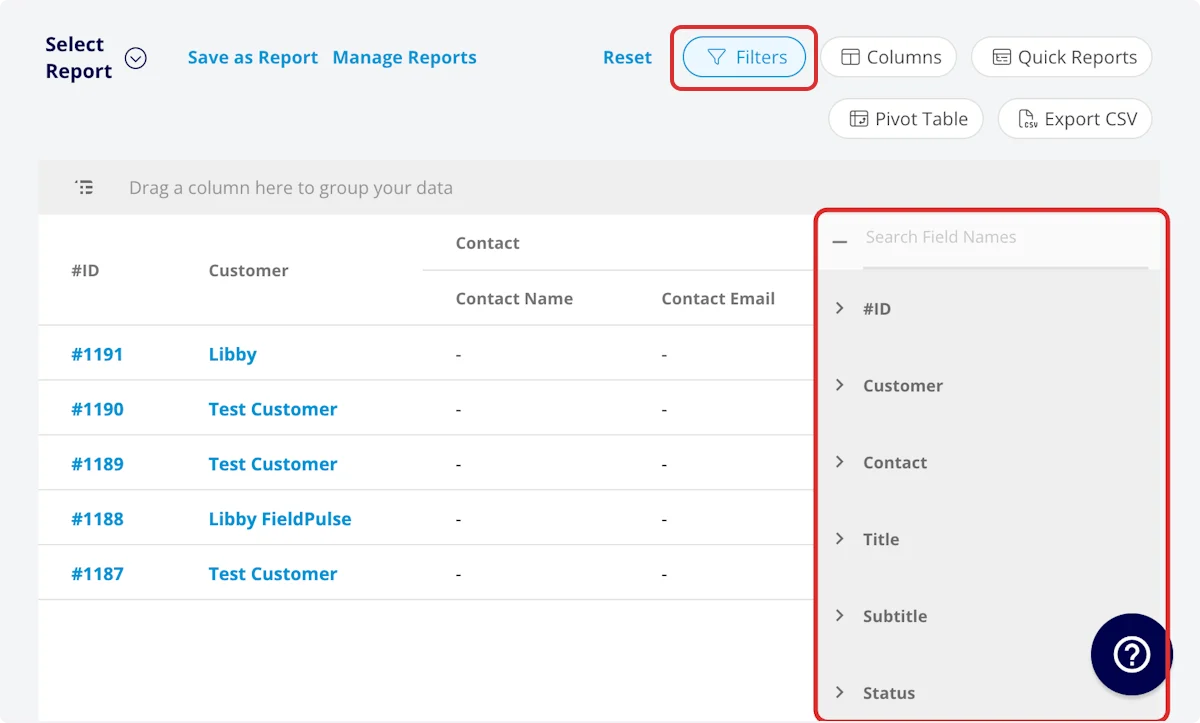 The **Filters** panel offers these fields:
| **Field** | **How you filter** |
| --------------------------------------- | ---------------------------------- |
| **#ID** | By contents |
| **Name** | By contents |
| **Status** | Select the status |
| **Customer** | By contents |
| **Location** | By contents |
| **Created At** | By date |
| **Created By** | By contents |
| **Job Notes** | By contents |
| **Notes** | By contents |
| **Description** | By contents |
| **Start Date** | By date |
| **End Date** | By date |
| **Start Time** | By date |
| **End Time** | By date |
| **Assigned Teams** | By contents |
| **Custom Fields** | Select the custom field |
| **Older Than** | A whole number and a duration unit |
| **Within the Last** | A whole number and a duration unit |
| **Within the Next** | A whole number and a duration unit |
| **Customer — Customer Phone** | Select the phone number |
| **Customer — Customer Email** | Select the email address |
| **Customer — Customer Phone 2** | Select the phone number |
| **Customer — Customer Email 2** | Select the email address |
| **Customer — Customer Assigned To** | By contents |
| **Customer — Customer Pipeline Status** | Select the status |
| **Customer — Customer Next Steps** | By contents |
| **Customer — Customer Notes** | By contents |
| **Customer — Customer Job Notes** | By contents |
| **Customer — Customer Created Date** | By contents |
| **Customer — Customer Tags** | By contents |
**Older Than**, **Within the Last**, and **Within the Next** take a whole number and a duration unit, from Minutes through Decades. These filters calculate dynamically from the current time in your timezone every time the report runs, so your saved reports never go stale.
### Filter operators
When you filter by contents, choose an operator and then enter the values to filter the data on.
| **Operator** | **Retrieves data** | **Example** | **Data retrieved** |
| ------------------------ | ------------------------------------------ | ------------------------------------------------- | ----------------------------------------------------------- |
| Equals | Equal to a specified value | Created By - Equals Tom Gause | For all records created by Tom Gause only |
| Not Equal | Different from a specified value | Tag - Not Equal to HVAC | For all records except those using the HVAC tag |
| Less Than | Lower than a specified value | #ID - Less than 1144 | For all records below #1144 |
| Less Than or Equal To | Lower than or equal to a specified value | Job Date/Time - Less than or equal to 12/13/2023 | For jobs scheduled before or on 12/13/2023 |
| Greater Than | Greater than a specified value | Job Duration - Greater than 60 minutes | For jobs in the In Progress status type for over 60 minutes |
| Greater Than or Equal To | Greater than or equal to a specified value | Job Date/Time - Greater than or equal to 1/1/2024 | For jobs scheduled on or after 1/1/2024 |
| In Range | Including and between two specified values | #ID - Between 1225 and 1236 | For all estimate records with #IDs between 1225 and 1236 |
| Starts With | Begins with a specified value | Title - Annual | For all job records beginning with Annual |
| Ends With | Ends with a specified value | Location - TX | For all job locations ending with TX |
| Blank | No values are in the field | Subtitle | For all job records with blank subtitles |
| Not Blank | Values in the field | Notes | For all job records with values in the notes field |
## Common project reports
Common project reports include projects by status, projects by tag, and projects by assigned team. Here is how the first and the last of those are built.
### Projects by status
Use this report to view your projects sorted by status.
* **Columns:** customize to your needs, but include **Status**.
* **Group by:** **Status**
### Projects by assigned team
Use this report to view your current projects sorted by assigned team, so you can compare workloads across your business.
* **Columns:** customize to your needs, but include **Assigned Teams** and **Status**.
* **Filter:** **Status** = *In Progress*
* **Group by:** **Assigned Teams**
## Tips
* The project report tracks work at the team level. It has an **Assigned Teams** column and a **Completion Percentage** column, and no column for the individual users on the work. The job report carries an **Assigned Team Members** column for the users assigned to a job — see [How to Create Job Reports](/reporting/raw-data/job-reports).
* To see money alongside progress, keep the **Related Estimates**, **Accepted Estimates Total (Pre-Tax)**, **Total Invoice Pre-Tax Subtotal**, and **Related Invoice** columns next to **Status** and **Completion Percentage**.
## FAQs
### Can I save a project report to use again?
Yes. Select **Save as Report**, then **Save as New** to store it under **Select Report**, or **Save as Widget** to add it to your Pulse Dashboard. See [How to Use Raw Data Reporting](/reporting/raw-data/using-raw-data-reporting) for the full saving flow.
### Can I export a project report to a spreadsheet?
Yes. Select **Export CSV** to download the report currently on your screen as a CSV file to your device.
## Related articles
* [How to Use Raw Data Reporting](/reporting/raw-data/using-raw-data-reporting)
* [Project Management Overview](/jobs/projects/overview)
* [Projects vs. Jobs vs. Site Visits Details](/jobs/projects/projects-vs-jobs-vs-site-visits)
* [How to Create Job Reports](/reporting/raw-data/job-reports)
Your project report is working when the table returns the projects you expected for the date range, shows the status and completion columns you selected, and groups into the teams or statuses you want to compare once your filters are applied.
## Related topics
- [How to Create Timesheet Reports](/reporting/raw-data/timesheet-reports.md)
- [How to Create Subtask Reports](/reporting/raw-data/subtask-reports.md)
- [Project Management Overview](/jobs/projects/overview.md)
- [How to Use Raw Data Reporting](/reporting/raw-data/using-raw-data-reporting.md)
The **Filters** panel offers these fields:
| **Field** | **How you filter** |
| --------------------------------------- | ---------------------------------- |
| **#ID** | By contents |
| **Name** | By contents |
| **Status** | Select the status |
| **Customer** | By contents |
| **Location** | By contents |
| **Created At** | By date |
| **Created By** | By contents |
| **Job Notes** | By contents |
| **Notes** | By contents |
| **Description** | By contents |
| **Start Date** | By date |
| **End Date** | By date |
| **Start Time** | By date |
| **End Time** | By date |
| **Assigned Teams** | By contents |
| **Custom Fields** | Select the custom field |
| **Older Than** | A whole number and a duration unit |
| **Within the Last** | A whole number and a duration unit |
| **Within the Next** | A whole number and a duration unit |
| **Customer — Customer Phone** | Select the phone number |
| **Customer — Customer Email** | Select the email address |
| **Customer — Customer Phone 2** | Select the phone number |
| **Customer — Customer Email 2** | Select the email address |
| **Customer — Customer Assigned To** | By contents |
| **Customer — Customer Pipeline Status** | Select the status |
| **Customer — Customer Next Steps** | By contents |
| **Customer — Customer Notes** | By contents |
| **Customer — Customer Job Notes** | By contents |
| **Customer — Customer Created Date** | By contents |
| **Customer — Customer Tags** | By contents |
**Older Than**, **Within the Last**, and **Within the Next** take a whole number and a duration unit, from Minutes through Decades. These filters calculate dynamically from the current time in your timezone every time the report runs, so your saved reports never go stale.
### Filter operators
When you filter by contents, choose an operator and then enter the values to filter the data on.
| **Operator** | **Retrieves data** | **Example** | **Data retrieved** |
| ------------------------ | ------------------------------------------ | ------------------------------------------------- | ----------------------------------------------------------- |
| Equals | Equal to a specified value | Created By - Equals Tom Gause | For all records created by Tom Gause only |
| Not Equal | Different from a specified value | Tag - Not Equal to HVAC | For all records except those using the HVAC tag |
| Less Than | Lower than a specified value | #ID - Less than 1144 | For all records below #1144 |
| Less Than or Equal To | Lower than or equal to a specified value | Job Date/Time - Less than or equal to 12/13/2023 | For jobs scheduled before or on 12/13/2023 |
| Greater Than | Greater than a specified value | Job Duration - Greater than 60 minutes | For jobs in the In Progress status type for over 60 minutes |
| Greater Than or Equal To | Greater than or equal to a specified value | Job Date/Time - Greater than or equal to 1/1/2024 | For jobs scheduled on or after 1/1/2024 |
| In Range | Including and between two specified values | #ID - Between 1225 and 1236 | For all estimate records with #IDs between 1225 and 1236 |
| Starts With | Begins with a specified value | Title - Annual | For all job records beginning with Annual |
| Ends With | Ends with a specified value | Location - TX | For all job locations ending with TX |
| Blank | No values are in the field | Subtitle | For all job records with blank subtitles |
| Not Blank | Values in the field | Notes | For all job records with values in the notes field |
## Common project reports
Common project reports include projects by status, projects by tag, and projects by assigned team. Here is how the first and the last of those are built.
### Projects by status
Use this report to view your projects sorted by status.
* **Columns:** customize to your needs, but include **Status**.
* **Group by:** **Status**
### Projects by assigned team
Use this report to view your current projects sorted by assigned team, so you can compare workloads across your business.
* **Columns:** customize to your needs, but include **Assigned Teams** and **Status**.
* **Filter:** **Status** = *In Progress*
* **Group by:** **Assigned Teams**
## Tips
* The project report tracks work at the team level. It has an **Assigned Teams** column and a **Completion Percentage** column, and no column for the individual users on the work. The job report carries an **Assigned Team Members** column for the users assigned to a job — see [How to Create Job Reports](/reporting/raw-data/job-reports).
* To see money alongside progress, keep the **Related Estimates**, **Accepted Estimates Total (Pre-Tax)**, **Total Invoice Pre-Tax Subtotal**, and **Related Invoice** columns next to **Status** and **Completion Percentage**.
## FAQs
### Can I save a project report to use again?
Yes. Select **Save as Report**, then **Save as New** to store it under **Select Report**, or **Save as Widget** to add it to your Pulse Dashboard. See [How to Use Raw Data Reporting](/reporting/raw-data/using-raw-data-reporting) for the full saving flow.
### Can I export a project report to a spreadsheet?
Yes. Select **Export CSV** to download the report currently on your screen as a CSV file to your device.
## Related articles
* [How to Use Raw Data Reporting](/reporting/raw-data/using-raw-data-reporting)
* [Project Management Overview](/jobs/projects/overview)
* [Projects vs. Jobs vs. Site Visits Details](/jobs/projects/projects-vs-jobs-vs-site-visits)
* [How to Create Job Reports](/reporting/raw-data/job-reports)
Your project report is working when the table returns the projects you expected for the date range, shows the status and completion columns you selected, and groups into the teams or statuses you want to compare once your filters are applied.
## Related topics
- [How to Create Timesheet Reports](/reporting/raw-data/timesheet-reports.md)
- [How to Create Subtask Reports](/reporting/raw-data/subtask-reports.md)
- [Project Management Overview](/jobs/projects/overview.md)
- [How to Use Raw Data Reporting](/reporting/raw-data/using-raw-data-reporting.md)