> ## Documentation Index
> Fetch the complete documentation index at: https://help.fieldpulse.com/llms.txt
> Use this file to discover all available pages before exploring further.
# Custom Reporting Dashboard
> Build a live dashboard from your saved reports so key numbers stay current and you see only the metrics you pick.
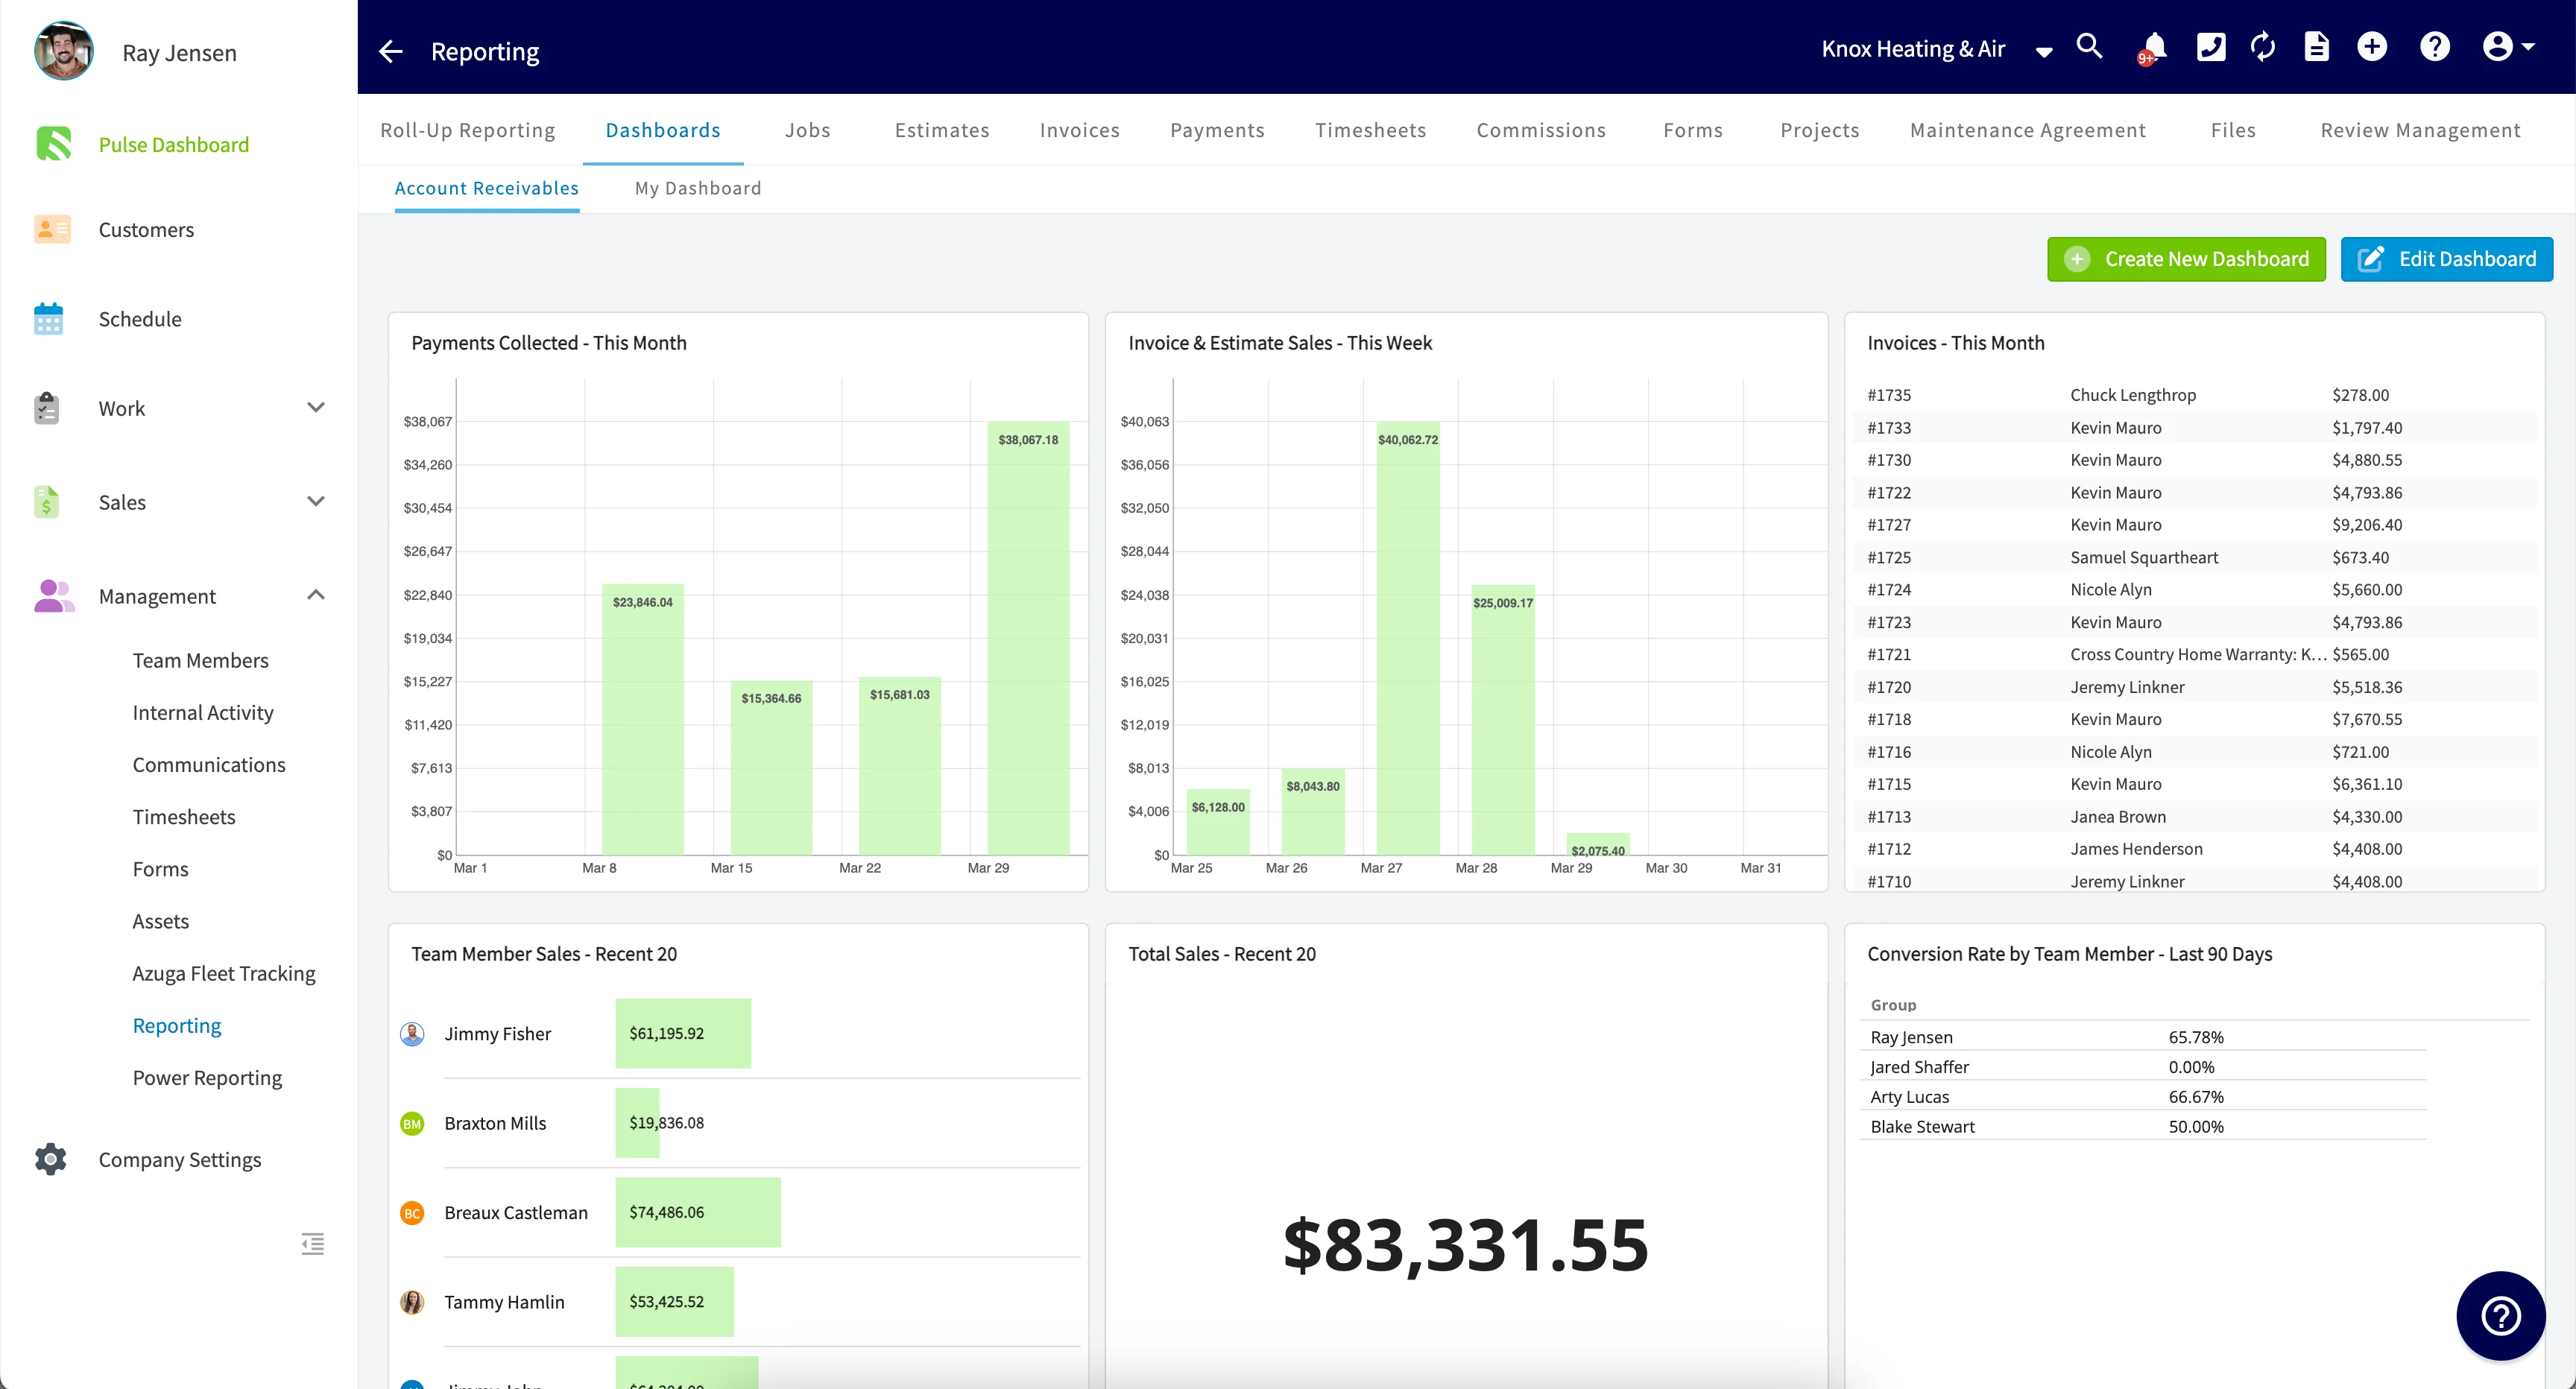
FieldPulse's Custom Reporting Dashboard puts all your business data in one place. It updates automatically, so you can see everything you need at a glance. Plus, you can customize it to include only the reports that matter most to you.
 **To learn more, watch the [FieldPulse360: Reporting Upgrades session](/training-resources/fieldpulse360/fieldpulse360-archives/fieldpulse360-reporting-upgrades).**
***
# Building Custom Reports
To build your custom reporting dashboard, you will first need to generate and save custom reports to display on your dashboard. Both traditional reports and visual reports can be included in your custom reporting dashboard.
Navigate to *Reporting* in the left-side menu under the *Management* tab.
**To learn more, watch the [FieldPulse360: Reporting Upgrades session](/training-resources/fieldpulse360/fieldpulse360-archives/fieldpulse360-reporting-upgrades).**
***
# Building Custom Reports
To build your custom reporting dashboard, you will first need to generate and save custom reports to display on your dashboard. Both traditional reports and visual reports can be included in your custom reporting dashboard.
Navigate to *Reporting* in the left-side menu under the *Management* tab.
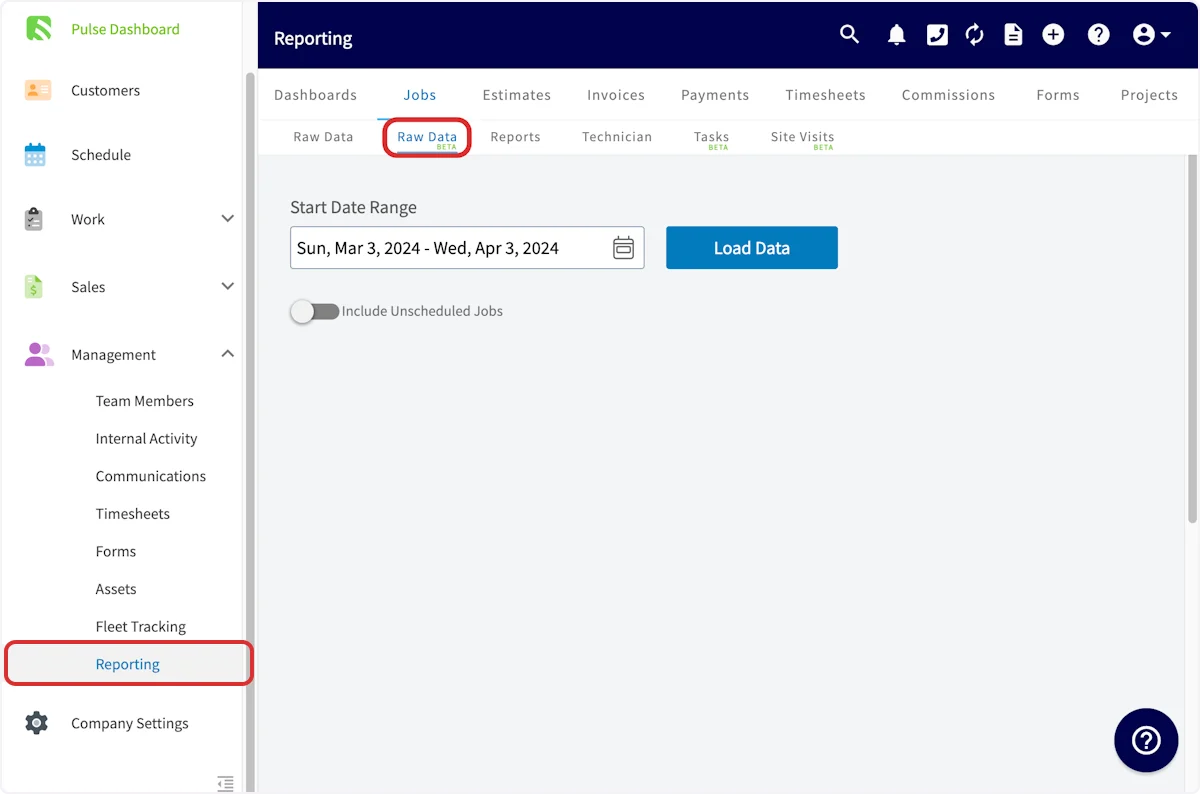 From here, generate the raw data beta report that you'd like to use on your custom reporting dashboard. To learn more about creating raw data beta reports, visit the [Raw Data Beta Reporting article](/using-fieldpulse/reporting/raw-data-reporting) or watch the [FieldPulse360 Raw Data Beta session recording](/training-resources/fieldpulse360/fieldpulse360-archives/fieldpulse360-raw-data-reporting).
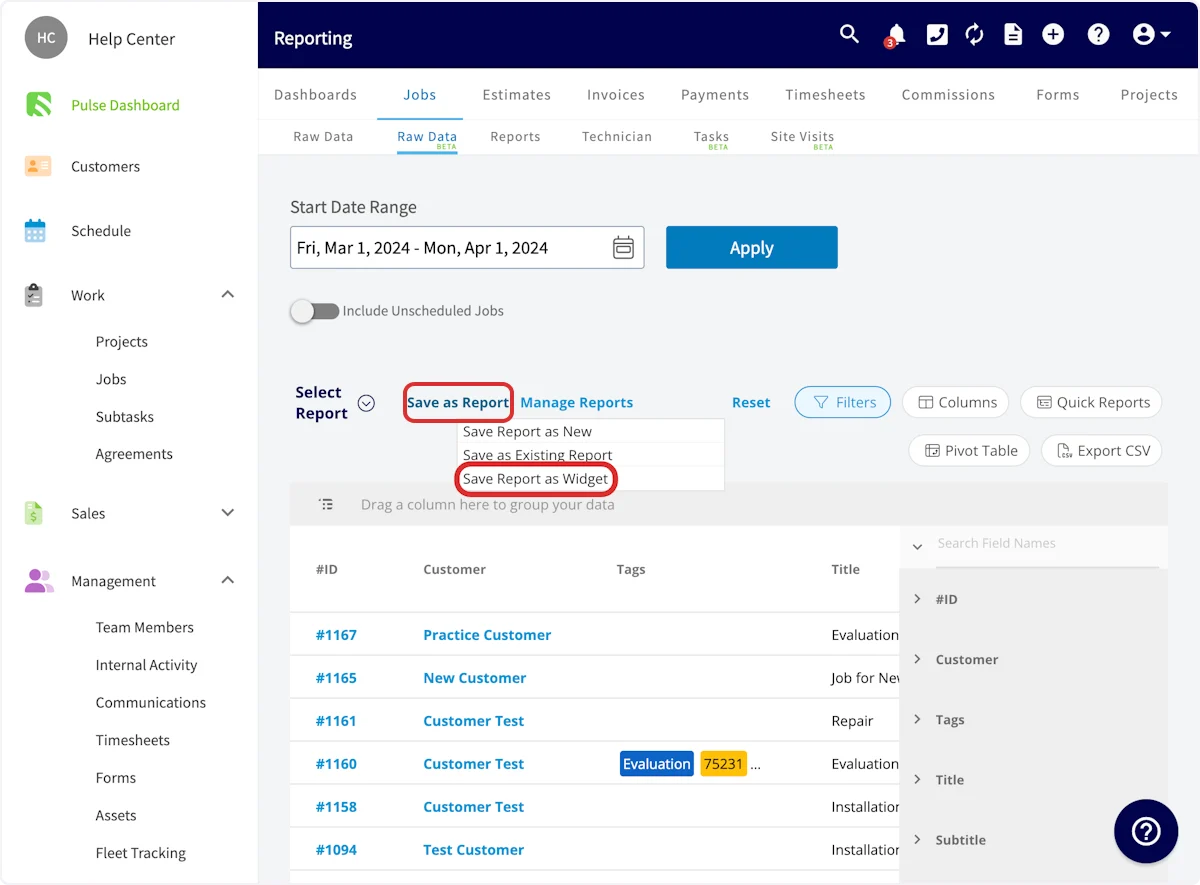
Once you have adjusted the report to your preference, select *Save as Report*, then *Save as Widget*.
From here, generate the raw data beta report that you'd like to use on your custom reporting dashboard. To learn more about creating raw data beta reports, visit the [Raw Data Beta Reporting article](/using-fieldpulse/reporting/raw-data-reporting) or watch the [FieldPulse360 Raw Data Beta session recording](/training-resources/fieldpulse360/fieldpulse360-archives/fieldpulse360-raw-data-reporting).
Once you have adjusted the report to your preference, select *Save as Report*, then *Save as Widget*.
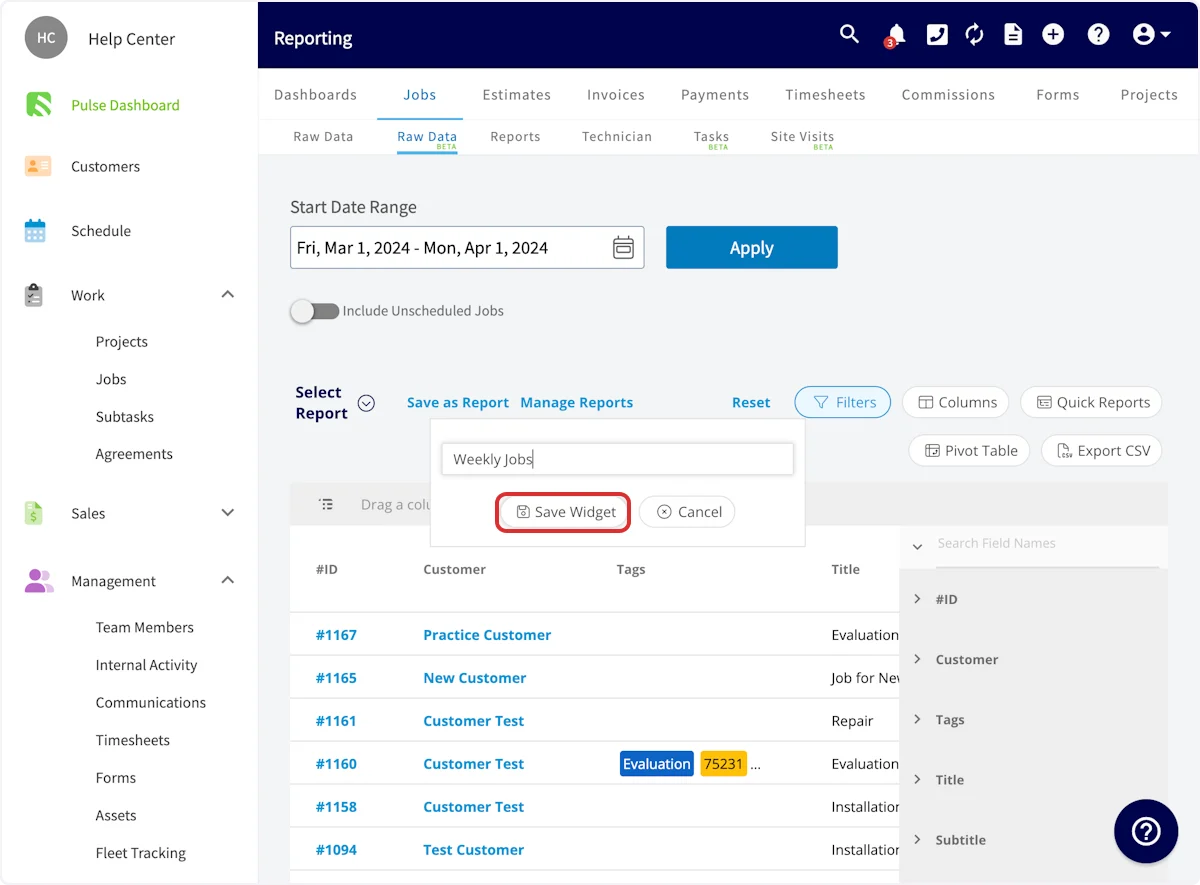
 You'll then need to give your report a title and press *Save*.
 Repeat this process for every report you want to include in the custom reporting dashboard.
***
# Configuring Your Dashboard
After creating and saving your reports as widgets, navigate to your *Pulse Dashboard* and select *Configure Dashboard*. Once here, you have the ability to select which reports to include, as well as the time period of data to display and the size of each widget and row.
Repeat this process for every report you want to include in the custom reporting dashboard.
***
# Configuring Your Dashboard
After creating and saving your reports as widgets, navigate to your *Pulse Dashboard* and select *Configure Dashboard*. Once here, you have the ability to select which reports to include, as well as the time period of data to display and the size of each widget and row.
 ## Selecting Reports
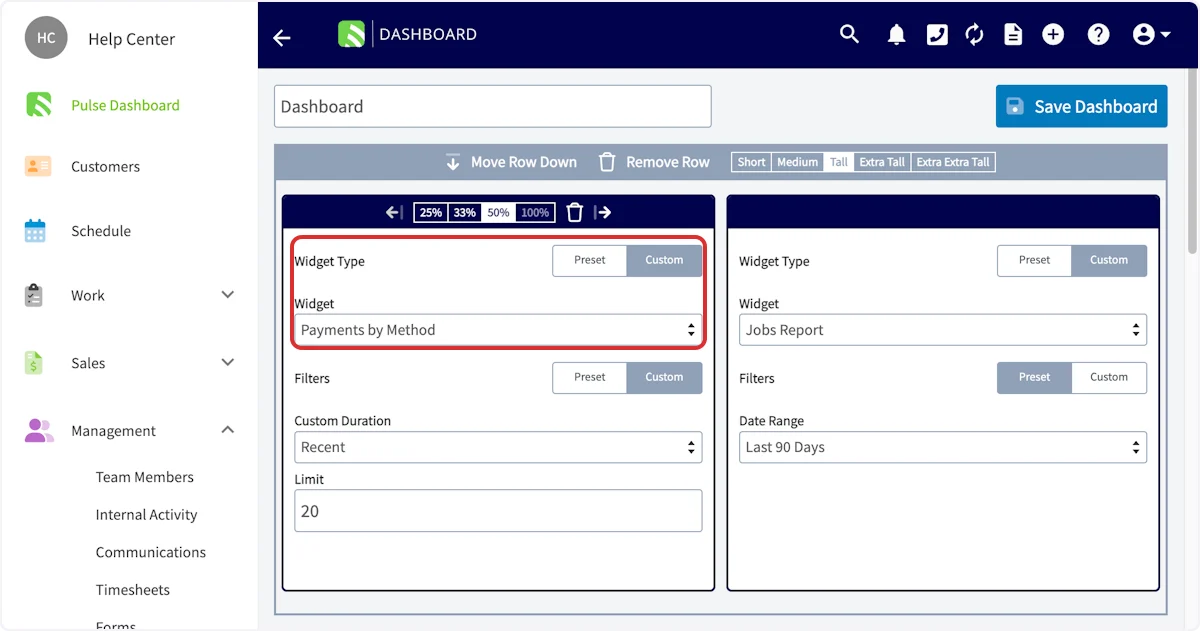
Select from *Preset* or *Custom* widget types. To use the custom reports you just created, select *Custom*, then select the name of your desired custom report.
## Selecting Reports
Select from *Preset* or *Custom* widget types. To use the custom reports you just created, select *Custom*, then select the name of your desired custom report.
 ## Applying Filters
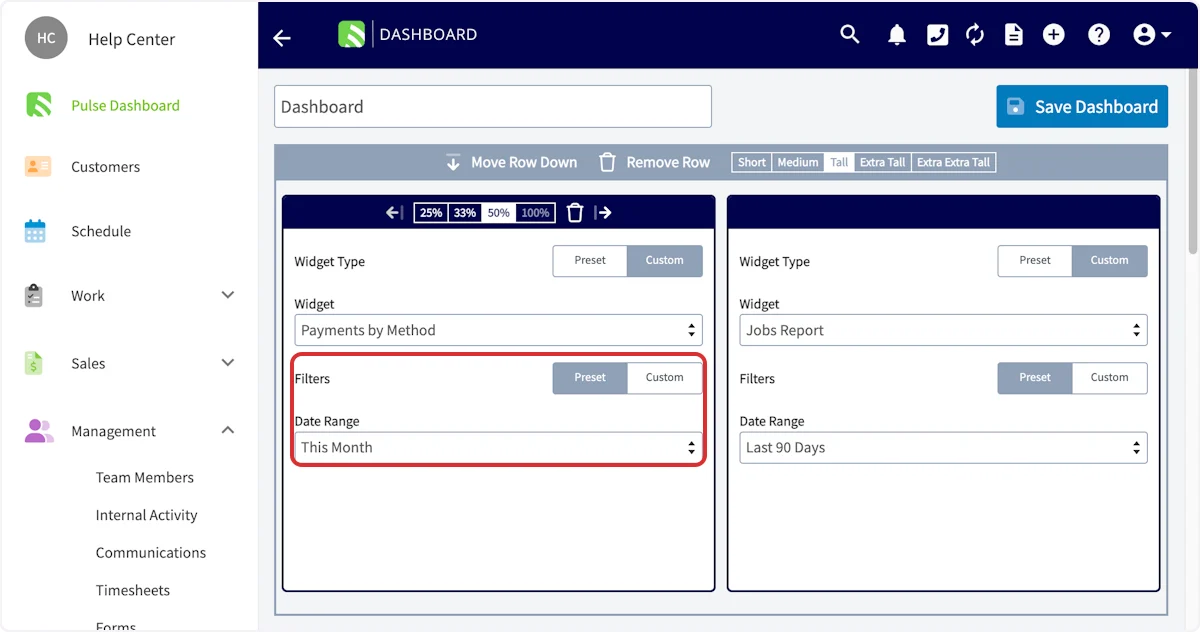
Filters allow you to select the date range of data displayed for this report. You can select from *Preset* options such as *This Month*, *Today*, or *Last 90 Days*, or select *Custom* to set the maximum number of recent data points that should be included in the report.
## Applying Filters
Filters allow you to select the date range of data displayed for this report. You can select from *Preset* options such as *This Month*, *Today*, or *Last 90 Days*, or select *Custom* to set the maximum number of recent data points that should be included in the report.
 ## Adjusting the Display
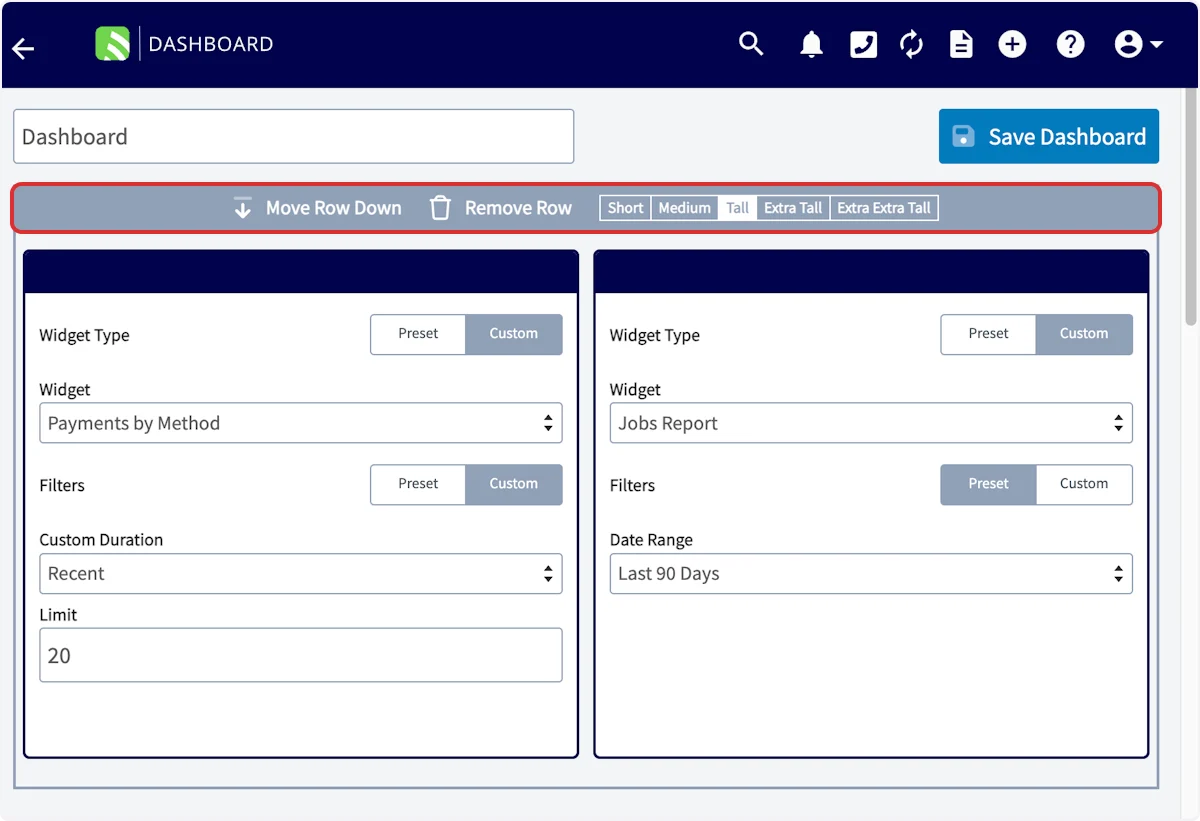
To adjust the appearance of your custom reporting dashboard, you can move the row up or down, remove the row entirely, or adjust the height from *Short* to *Extra Extra Tall*. All of these adjustments can be made in the gray bar above each row of widgets.
## Adjusting the Display
To adjust the appearance of your custom reporting dashboard, you can move the row up or down, remove the row entirely, or adjust the height from *Short* to *Extra Extra Tall*. All of these adjustments can be made in the gray bar above each row of widgets.
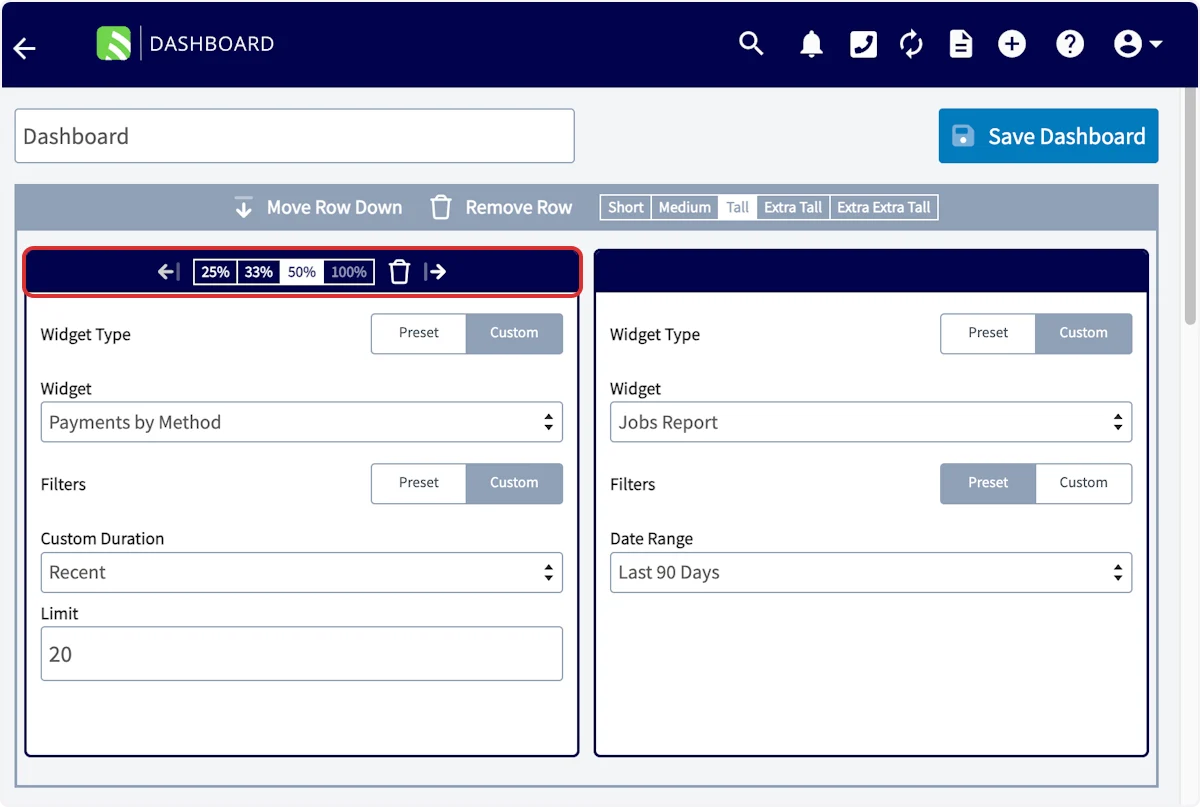
 You can also adjust the appearance of individual widgets. Choose from 25%, 33%, 50%, or 100% to select how much of the row that widget occupies. If you'd like to delete a widget entirely, select the trash can icon. You can also rearrange the widgets in a row using the left and right arrows at the top of the widget.
 To add additional rows or widgets, select *Add Row* or *Add Widget*.
When you are happy with your custom reporting dashboard, be sure to press *Save*. You can always adjust your dashboard in the future by selecting *Configure Dashboard* again.
***
# Creating Additional Dashboards
If you'd like to create additional custom reporting dashboards, you can build them under the *Reporting* tab. Select *Dashboards*, then click *Create New Dashboard*. While these dashboards will not display on your *Pulse Dashboard*, they provide convenience for you to view your reports in a grouping.
To add additional rows or widgets, select *Add Row* or *Add Widget*.
When you are happy with your custom reporting dashboard, be sure to press *Save*. You can always adjust your dashboard in the future by selecting *Configure Dashboard* again.
***
# Creating Additional Dashboards
If you'd like to create additional custom reporting dashboards, you can build them under the *Reporting* tab. Select *Dashboards*, then click *Create New Dashboard*. While these dashboards will not display on your *Pulse Dashboard*, they provide convenience for you to view your reports in a grouping.
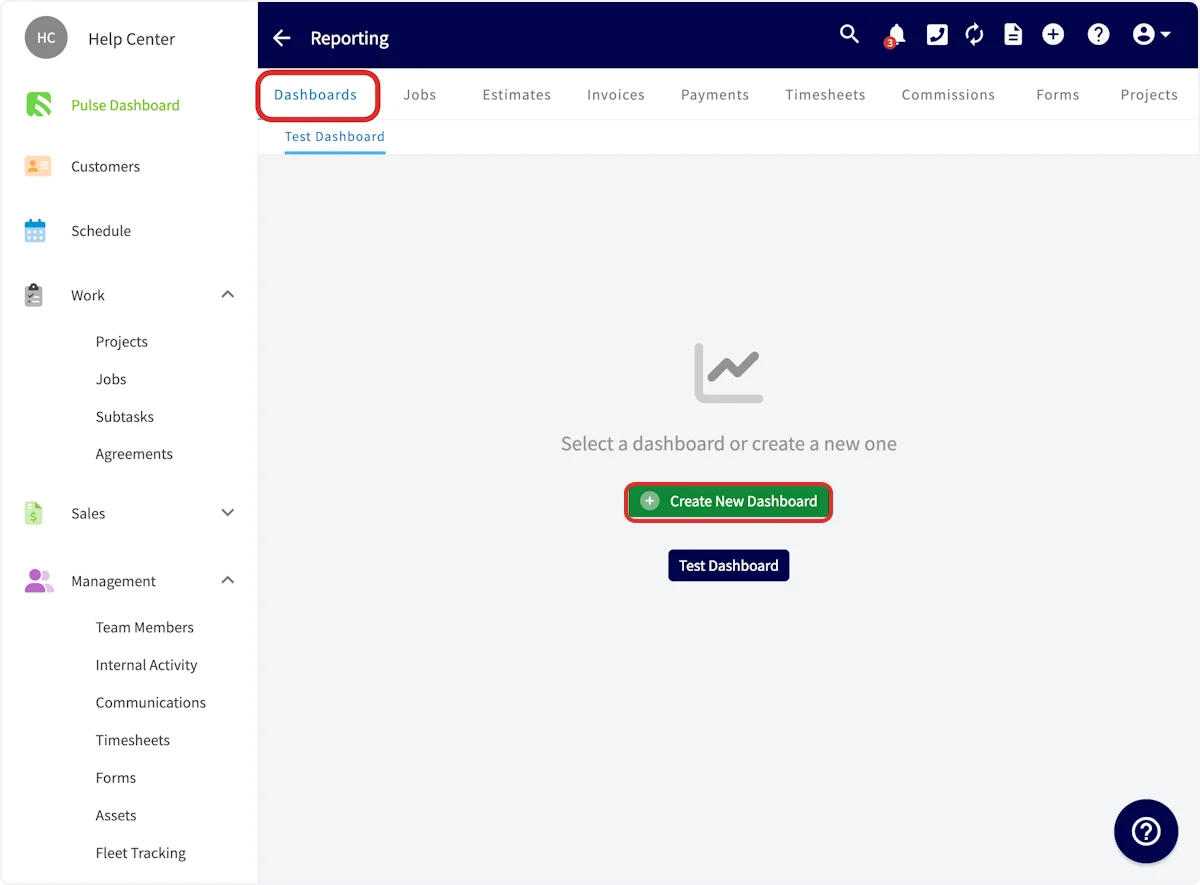 The additional dashboards created here will be accessible for all Admin users and Team Managers with reporting permissions.
***
# Video Tutorial
**To learn more, watch the [FieldPulse360: Reporting Upgrades session](/training-resources/fieldpulse360/fieldpulse360-archives/fieldpulse360-reporting-upgrades).**
***
**Have additional questions?**
*Contact us at [support@fieldpulse.com](mailto:support@fieldpulse.com) or use the chat feature in the bottom right corner of your screen.*
The additional dashboards created here will be accessible for all Admin users and Team Managers with reporting permissions.
***
# Video Tutorial
**To learn more, watch the [FieldPulse360: Reporting Upgrades session](/training-resources/fieldpulse360/fieldpulse360-archives/fieldpulse360-reporting-upgrades).**
***
**Have additional questions?**
*Contact us at [support@fieldpulse.com](mailto:support@fieldpulse.com) or use the chat feature in the bottom right corner of your screen.*