> ## Documentation Index
> Fetch the complete documentation index at: https://help.fieldpulse.com/llms.txt
> Use this file to discover all available pages before exploring further.
# Raw Data Reporting
> Build custom reports across jobs, invoices, payments, timesheets, and 14 other record types, then filter and export the exact fields you need.
FieldPulse's Raw Data Reporting feature allows you to generate and customize reports on your business. Reports can be created on many FieldPulse records, including:
* *Jobs*
* *Estimates*
* *Invoices*
* *Payments*
* *Timesheets*
* *Forms*
* *Projects*
* *Maintenance Agreements*
* *Assets*
* *Customers*
* *Orders*
* *Subtasks*
* *Reminders*
* *Serialized Inventory*
* *Item Usage*
**To learn more about Raw Data Reporting, view the [FieldPulse360 session recording](/training-resources/fieldpulse360/fieldpulse360-archives/fieldpulse360-raw-data-reporting).**
***
# Generating a Report
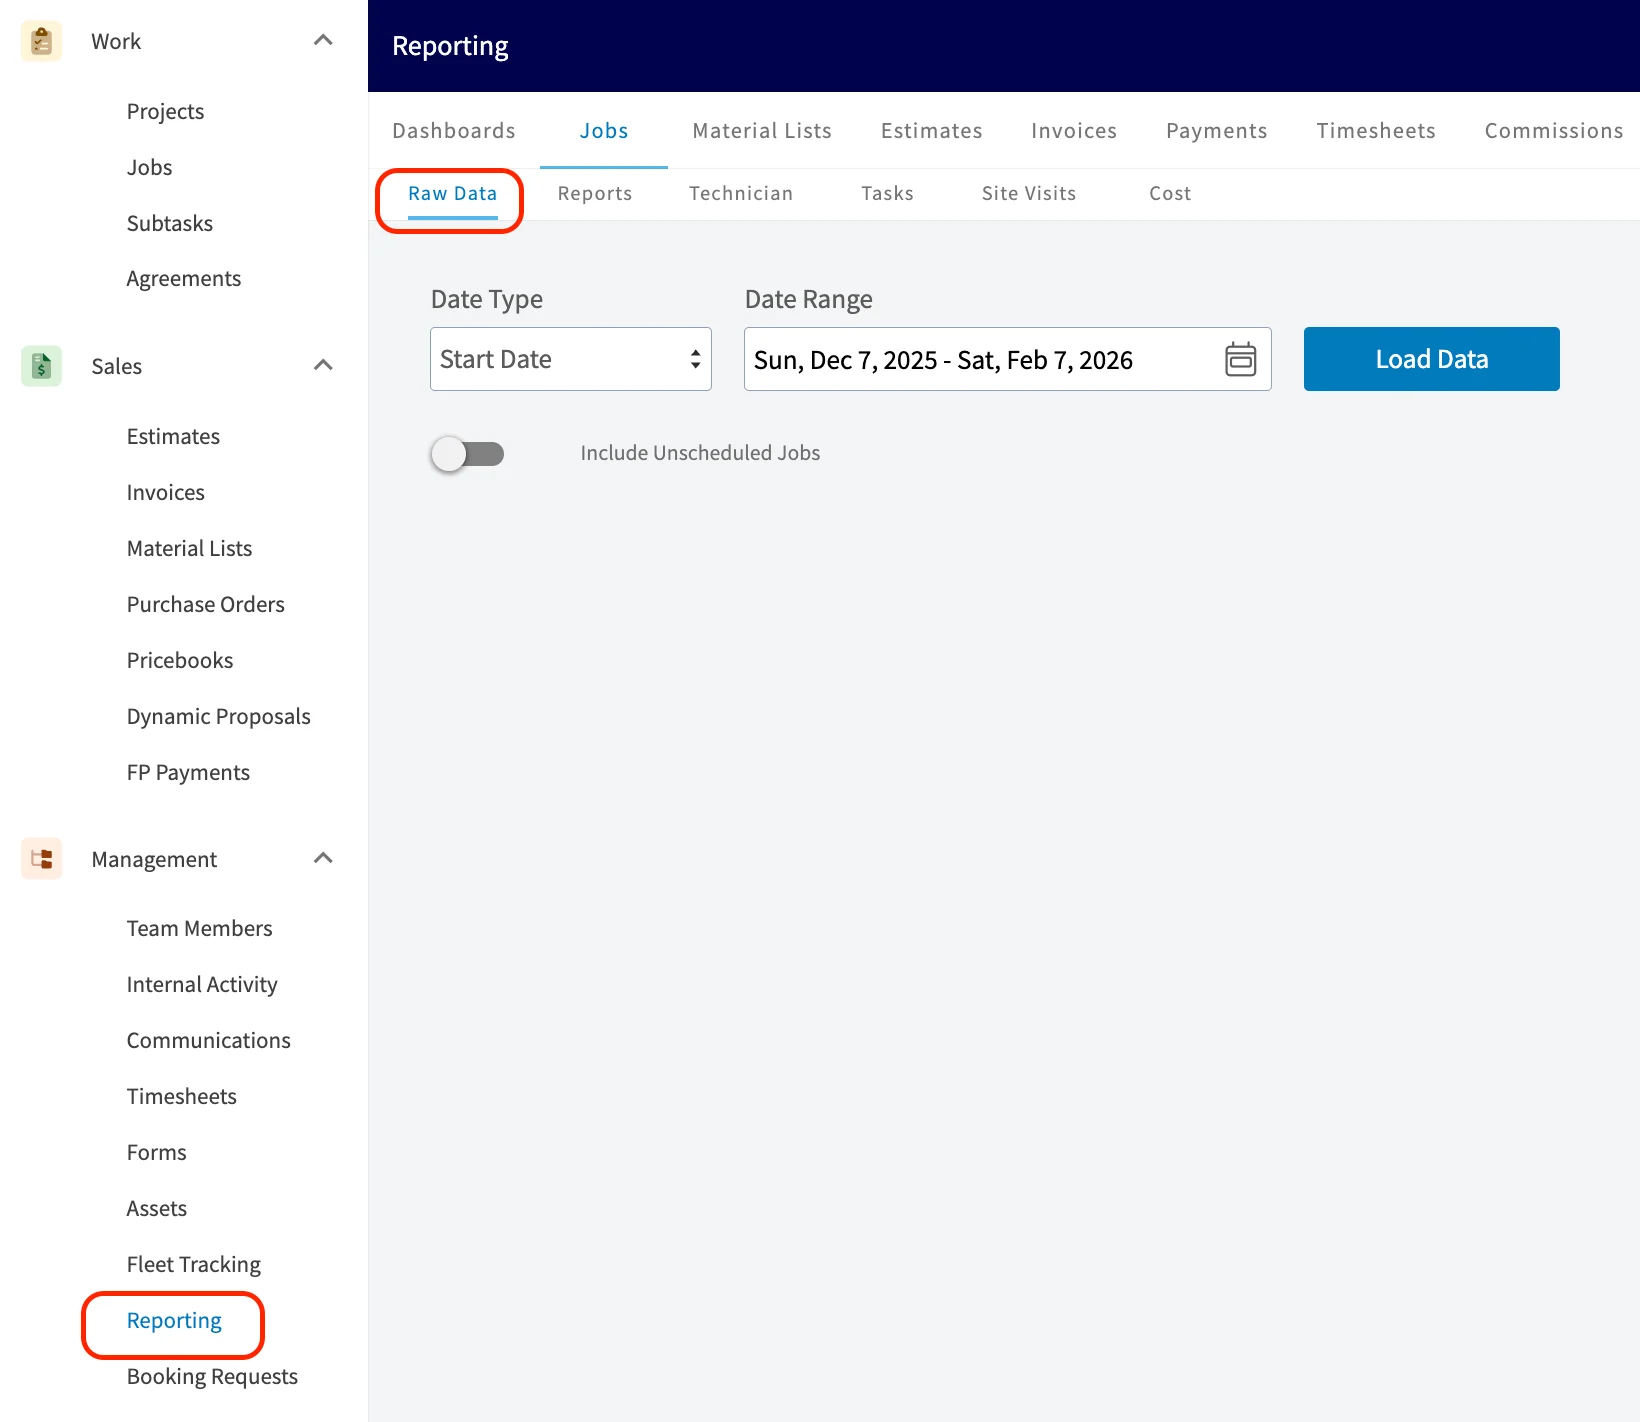
Begin by navigating to *Reporting* under the Management tab in the left-side menu, then select the record type for which you'd like to generate a report (e.g. *Jobs*). Select *Raw Data*.
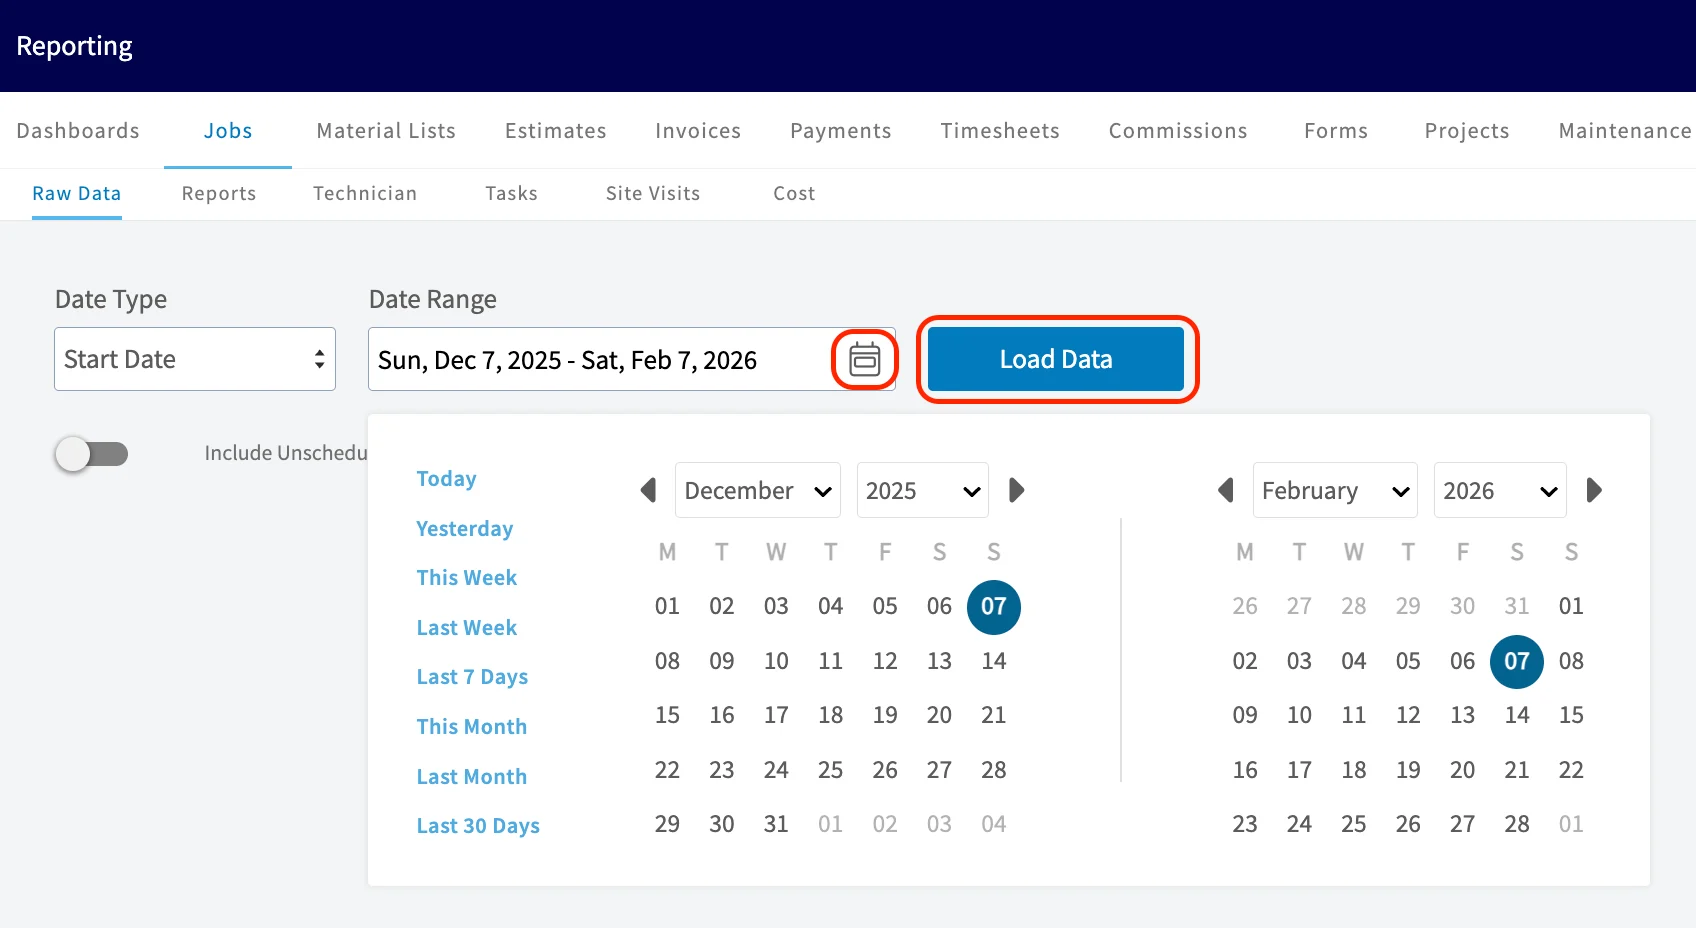
 Next, you'll need to customize your date range. Click on the calendar icon to select your dates, or use the quick service date options to the left of the calendars. Once you've selected your dates, click *Load Data*.
 ***
# Customizing a Report
## Filters
***
# Customizing a Report
## Filters
 This functionality allows you to filter your dataset on any field on the record. For example, you can filter to see only invoices that have been invoiced but not yet paid.
## Groupings
This functionality allows you to filter your dataset on any field on the record. For example, you can filter to see only invoices that have been invoiced but not yet paid.
## Groupings
 This functionality allows you to drag a column or multiple columns in order to group the data in that column by unique values. For example, if you selected the customers column to be grouped, the data would be grouped under each unique customer.
## Quick Reports
This functionality allows you to drag a column or multiple columns in order to group the data in that column by unique values. For example, if you selected the customers column to be grouped, the data would be grouped under each unique customer.
## Quick Reports
 This functionality allows you to quickly display a data report using a combination of standard data parameters than are commonly used to build reports. For example, you can quickly create a report for the total commission received each week grouped by the team member that received the commission.
## Columns
This functionality allows you to quickly display a data report using a combination of standard data parameters than are commonly used to build reports. For example, you can quickly create a report for the total commission received each week grouped by the team member that received the commission.
## Columns
 This functionality allows you to select which columns to display in your data table and in which order to display them.
## Pivot Table
This functionality allows you to select which columns to display in your data table and in which order to display them.
## Pivot Table
 We encourage you to explore the quick reports mentioned above, as they provide a straightforward way to access essential data. For those looking for more customization, pivot tables are an advanced option that allows you to create even further tailored reports. This powerful tool enables you to summarize and analyze large datasets quickly and easily. With pivot tables, you can transform complex information into clear, understandable segments, making it easier to identify trends and insights. Think of a pivot table as a way to rearrange your data, allowing you to view it from different perspectives. Instead of sifting through long lists of numbers, a pivot table helps you group and summarize data to highlight the most important information.
***
# Saving a Report
## Save as Report
We encourage you to explore the quick reports mentioned above, as they provide a straightforward way to access essential data. For those looking for more customization, pivot tables are an advanced option that allows you to create even further tailored reports. This powerful tool enables you to summarize and analyze large datasets quickly and easily. With pivot tables, you can transform complex information into clear, understandable segments, making it easier to identify trends and insights. Think of a pivot table as a way to rearrange your data, allowing you to view it from different perspectives. Instead of sifting through long lists of numbers, a pivot table helps you group and summarize data to highlight the most important information.
***
# Saving a Report
## Save as Report
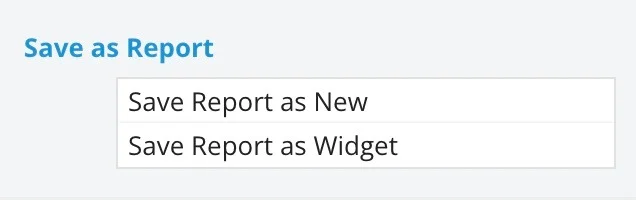 * **Save as New:** This will save your report under *Select Report* for easy access in the future. You will need to title and save your report.
* **Save as Widget:** This will save your report as a widget which can be added to your customized *Pulse Dashboard* in the future. You will need to title and save your widget.
## Export CSV
* **Save as New:** This will save your report under *Select Report* for easy access in the future. You will need to title and save your report.
* **Save as Widget:** This will save your report as a widget which can be added to your customized *Pulse Dashboard* in the future. You will need to title and save your widget.
## Export CSV
 This will initiate a download of the report currently displayed on your screen as a CSV file to your device.
***
# Building Visual Reports
Begin by navigating to *Reporting* under the Management tab in the left-side menu, then select the record type for which you'd like to generate a report (e.g. *Jobs*). Select *Raw Data Beta*.
Next, you'll need to customize your date range. Click on the calendar icon to select your dates, or use the quick service date options to the left of the calendars. Once you've selected your dates, click *Load Data*.
This will initiate a download of the report currently displayed on your screen as a CSV file to your device.
***
# Building Visual Reports
Begin by navigating to *Reporting* under the Management tab in the left-side menu, then select the record type for which you'd like to generate a report (e.g. *Jobs*). Select *Raw Data Beta*.
Next, you'll need to customize your date range. Click on the calendar icon to select your dates, or use the quick service date options to the left of the calendars. Once you've selected your dates, click *Load Data*.
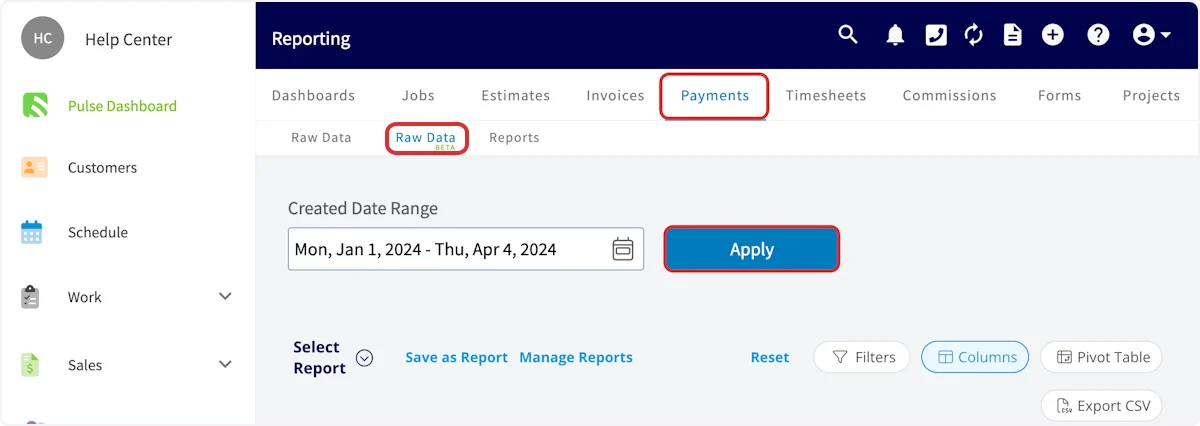 Customize your report using filters, groupings, and columns. When you're satisfied with your report, highlight the fields you'd like to be included in the visual report.
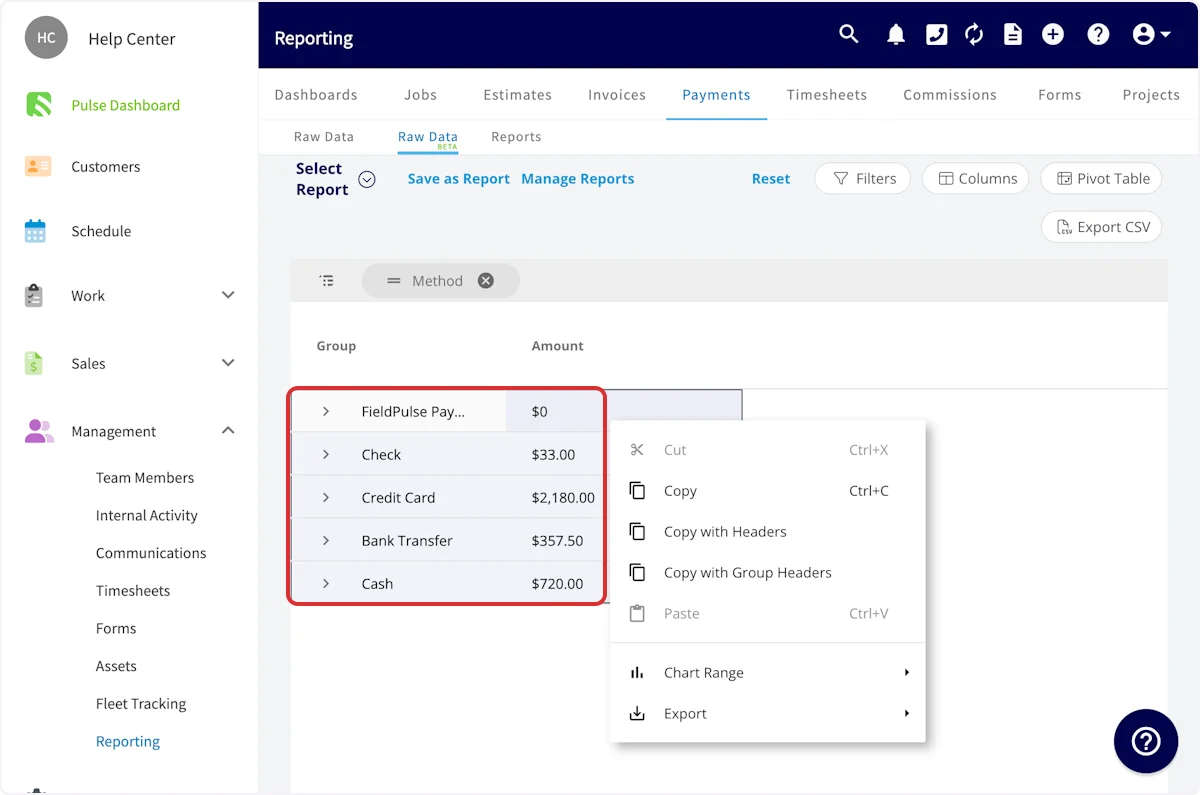 Right click in the highlighted area, then hover over *Chart Range*. You can now select the visual report type you'd like to use.
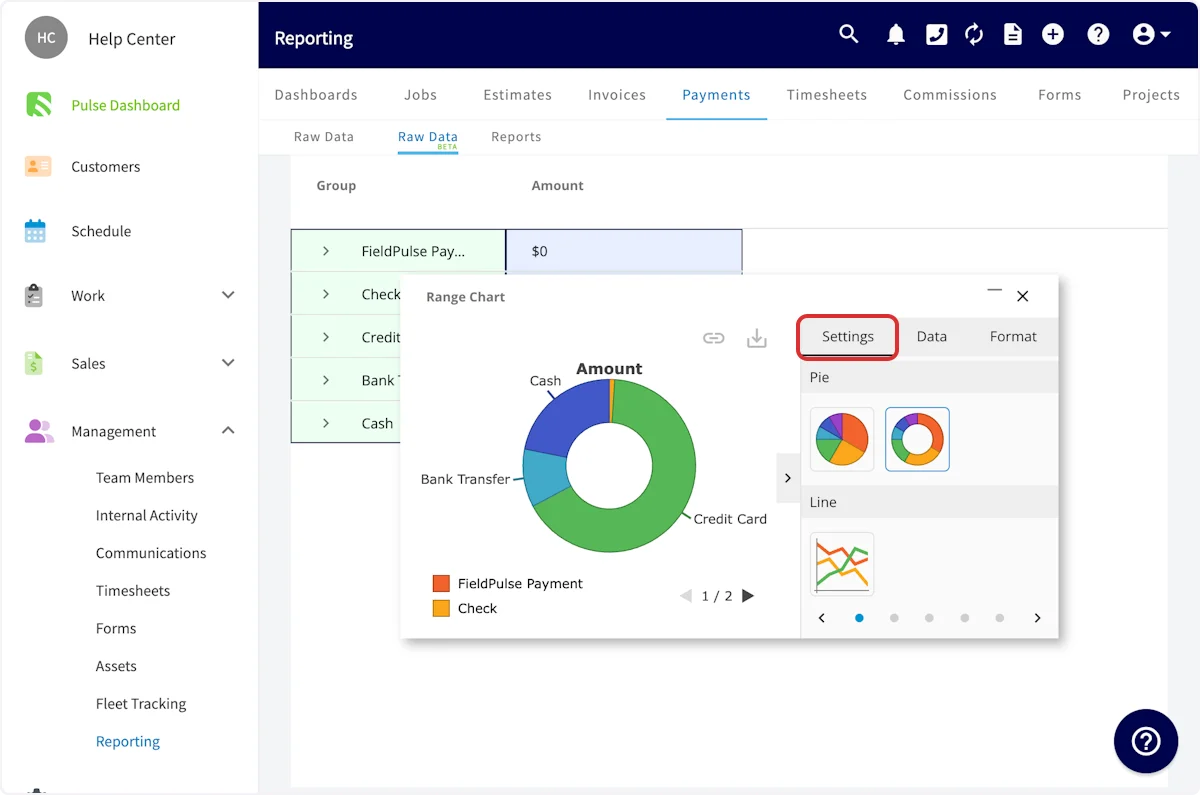
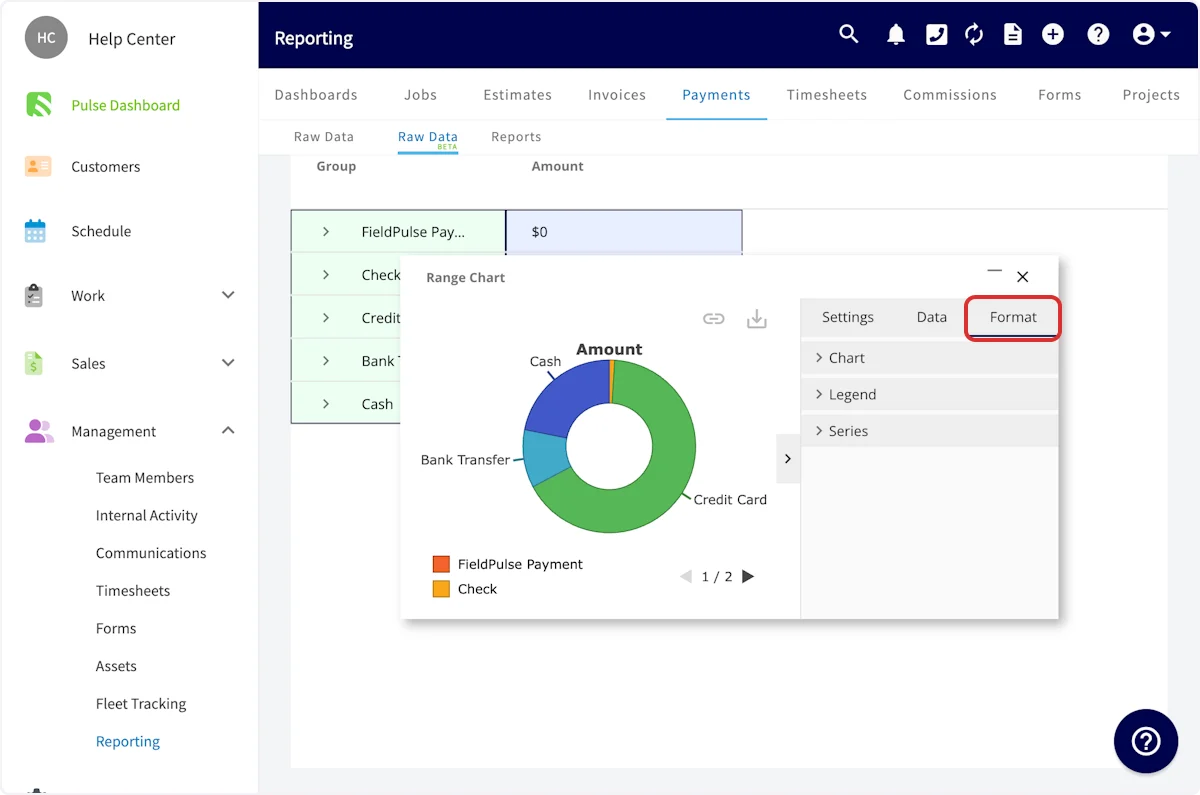
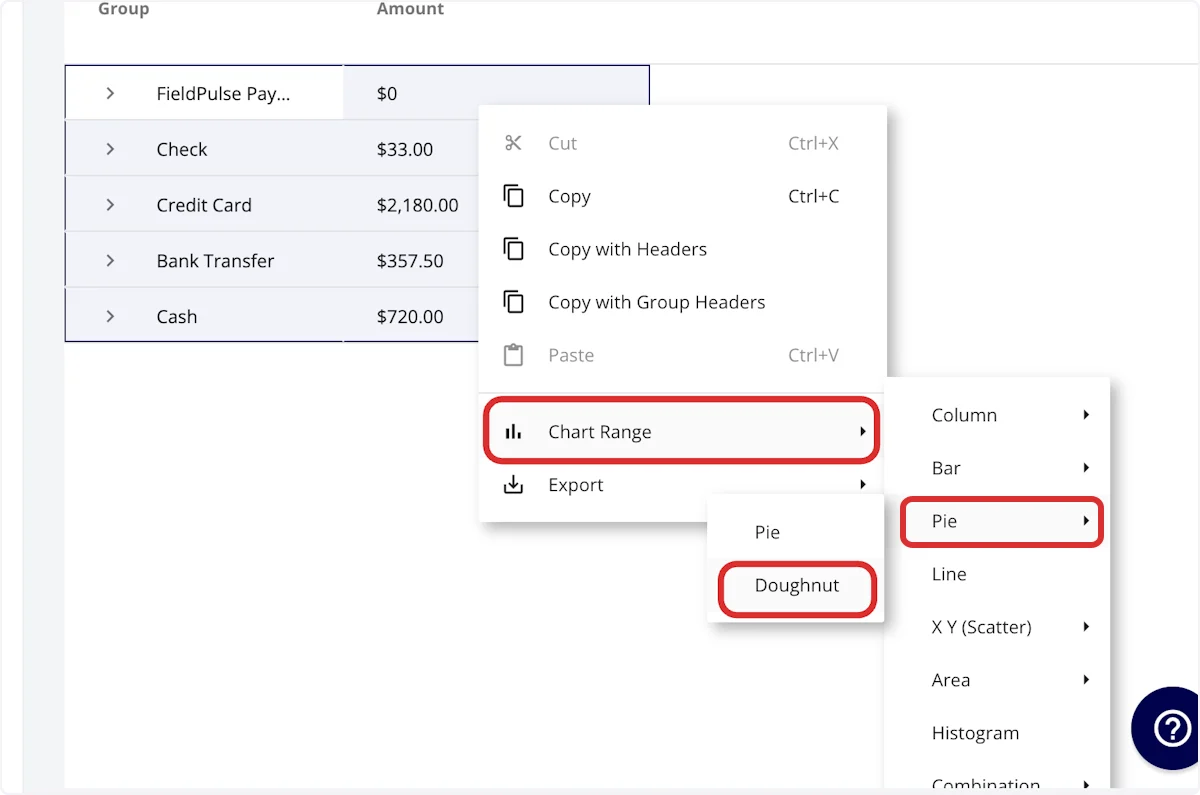 Use the *Settings* tab to adjust the report type and color scheme of your visual report.
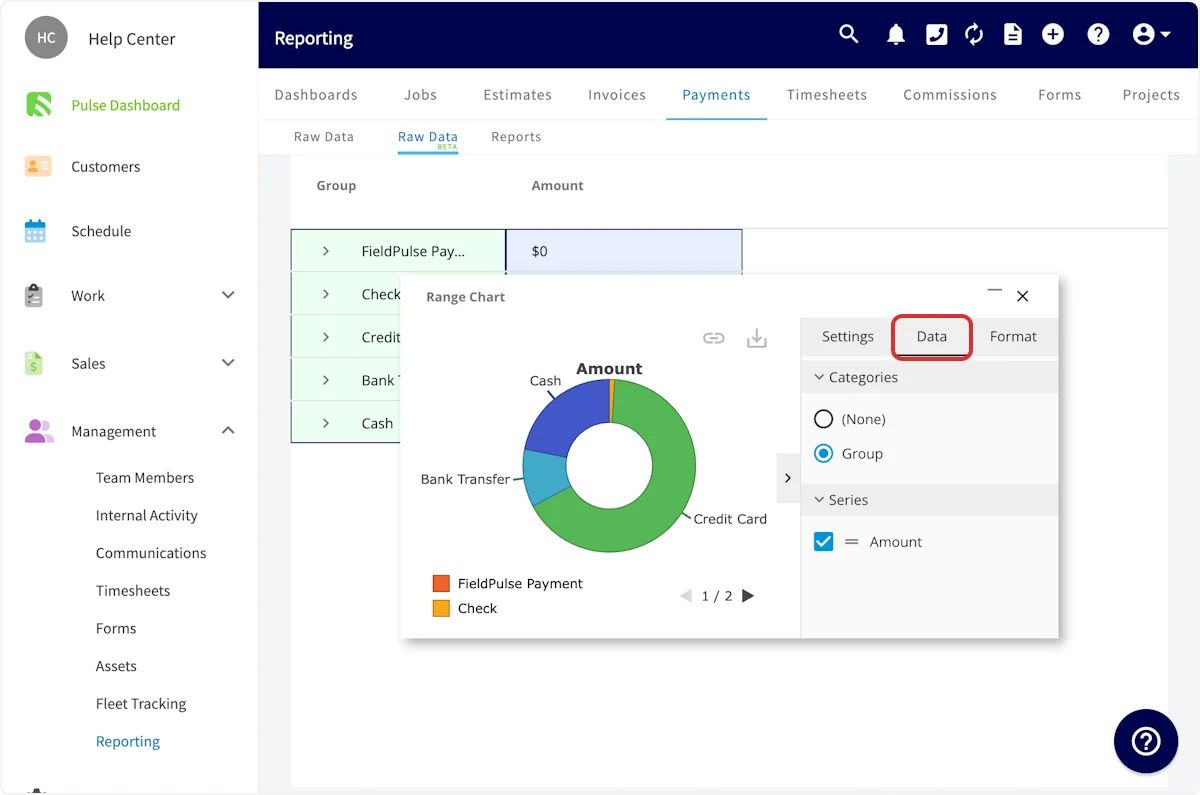
 Use the *Data* tab to adjust which categories are displayed on your visual report, as well as which fields are excluded.
 Use the *Format* tab to adjust the report appearance, including font type, font size, and legend specifics.
 **To learn more, watch the [FieldPulse360: Reporting Upgrades session](/training-resources/fieldpulse360/fieldpulse360-archives/fieldpulse360-reporting-upgrades).**
***
# Video Tutorials
**To learn more about Raw Data Reporting, view the [FieldPulse360 session recording](/training-resources/fieldpulse360/fieldpulse360-archives/fieldpulse360-raw-data-reporting)\*\*\*\*.**
***
**Have additional questions?**
*Contact us at [support@fieldpulse.com](mailto:support@fieldpulse.com) or use the chat feature in the bottom right corner of your screen.*
**To learn more, watch the [FieldPulse360: Reporting Upgrades session](/training-resources/fieldpulse360/fieldpulse360-archives/fieldpulse360-reporting-upgrades).**
***
# Video Tutorials
**To learn more about Raw Data Reporting, view the [FieldPulse360 session recording](/training-resources/fieldpulse360/fieldpulse360-archives/fieldpulse360-raw-data-reporting)\*\*\*\*.**
***
**Have additional questions?**
*Contact us at [support@fieldpulse.com](mailto:support@fieldpulse.com) or use the chat feature in the bottom right corner of your screen.*