- Jobs
- Estimates
- Invoices
- Payments
- Timesheets
- Forms
- Projects
- Maintenance Agreements
- Assets
- Customers
- Orders
- Subtasks
- Reminders
- Serialized Inventory
- Item Usage
Generating a Report
Begin by navigating to Reporting under the Management tab in the left-side menu, then select the record type for which you’d like to generate a report (e.g. Jobs). Select Raw Data.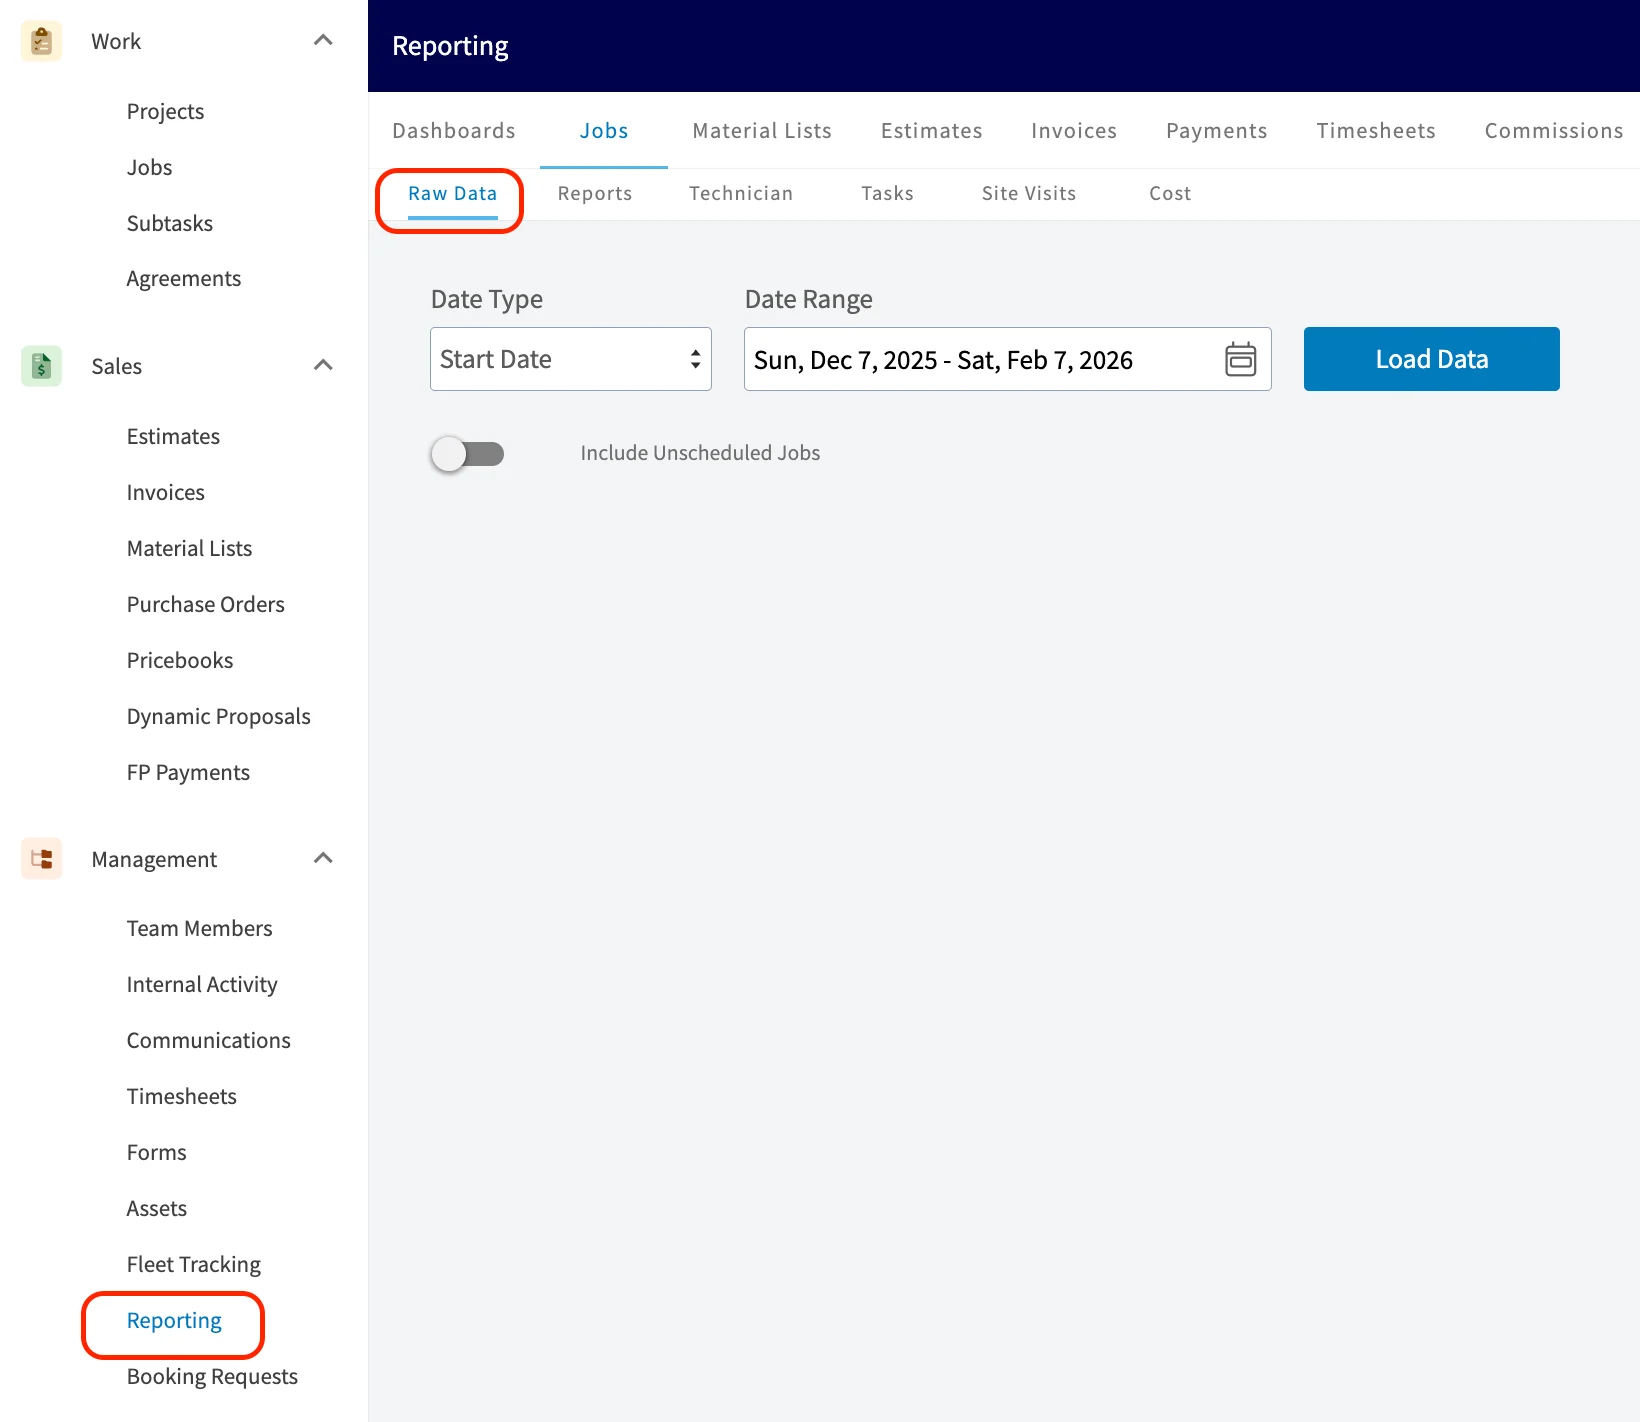
Customizing a Report
Filters

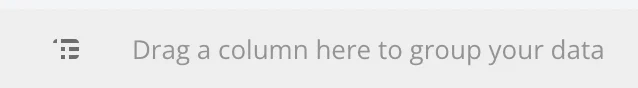
Groupings
Quick Reports

Columns

Pivot Table

Saving a Report
Save as Report
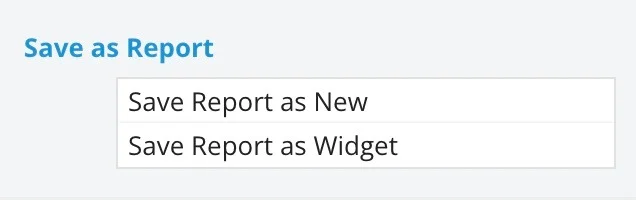
- Save as New: This will save your report under Select Report for easy access in the future. You will need to title and save your report.
- Save as Widget: This will save your report as a widget which can be added to your customized Pulse Dashboard in the future. You will need to title and save your widget.
Export CSV
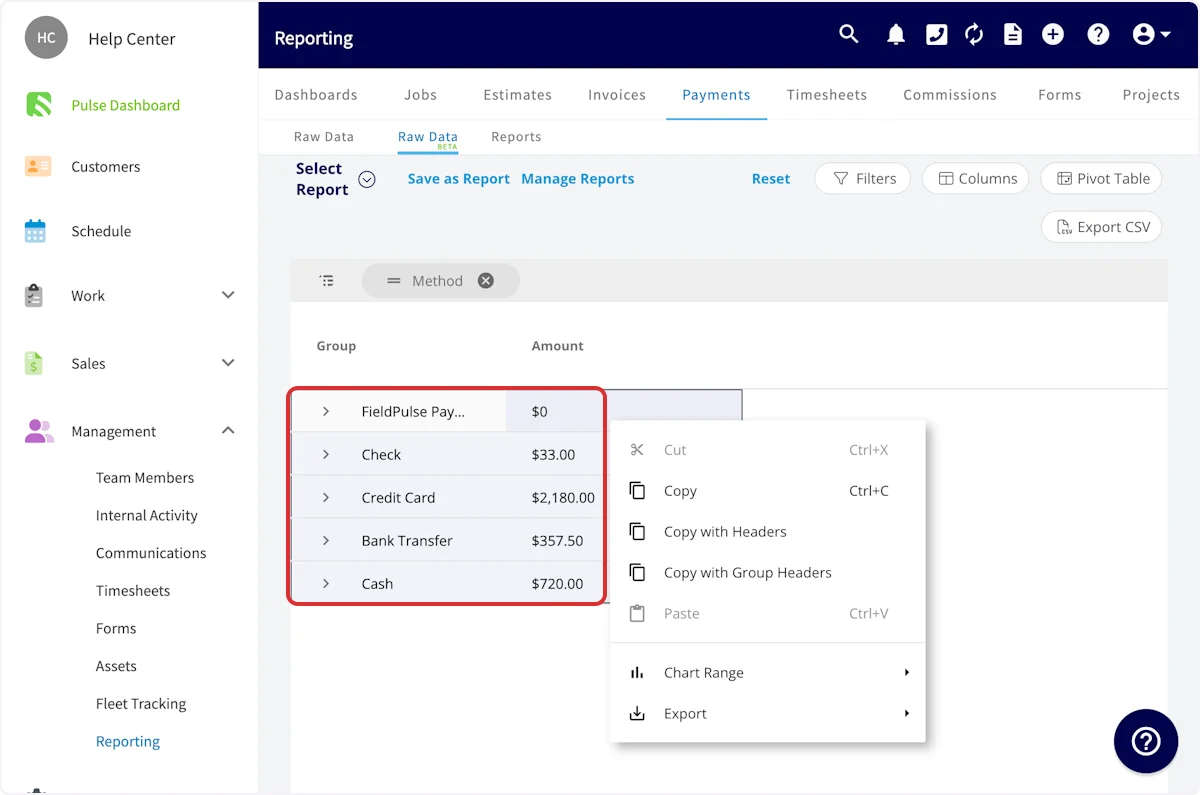
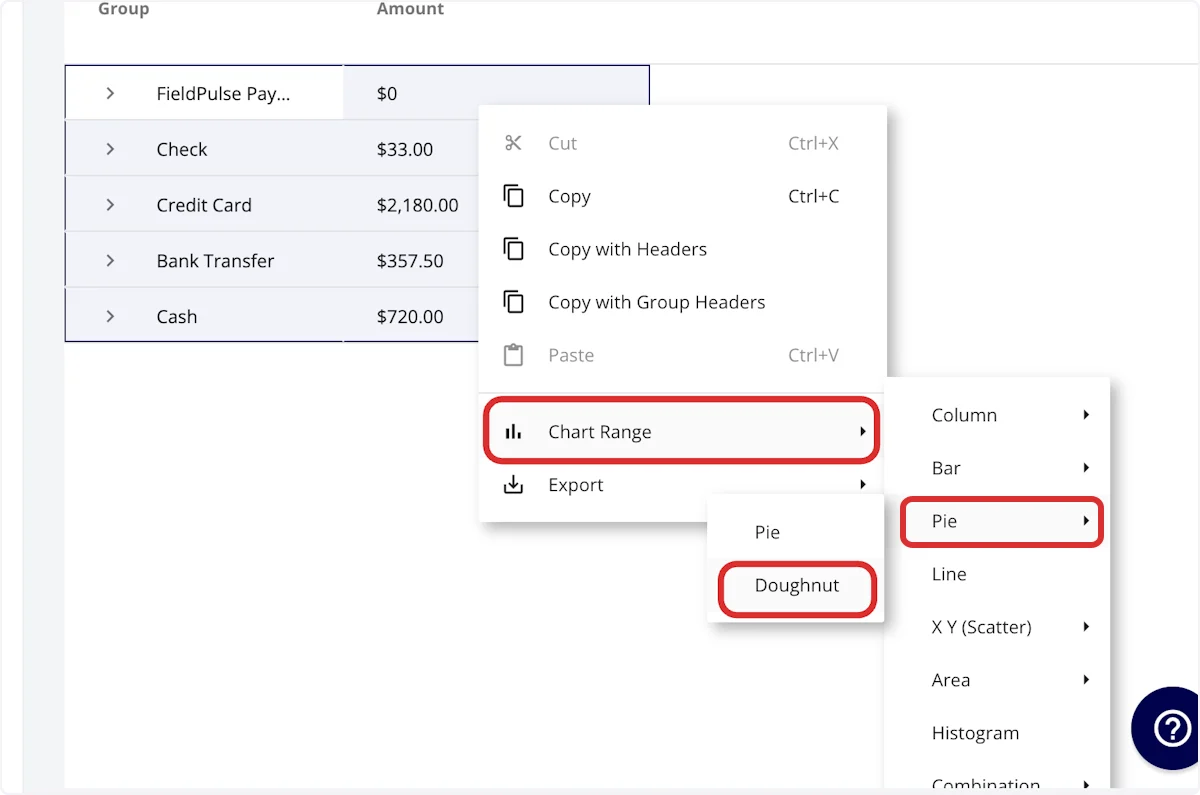
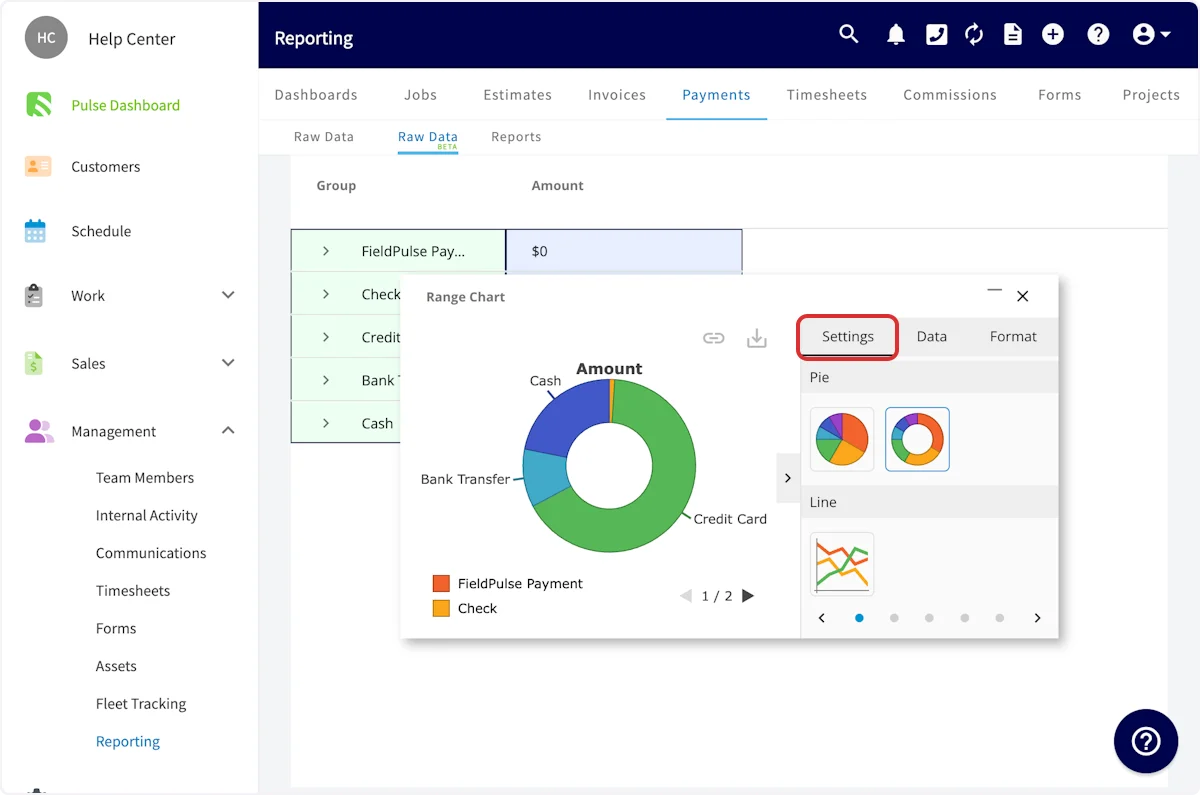
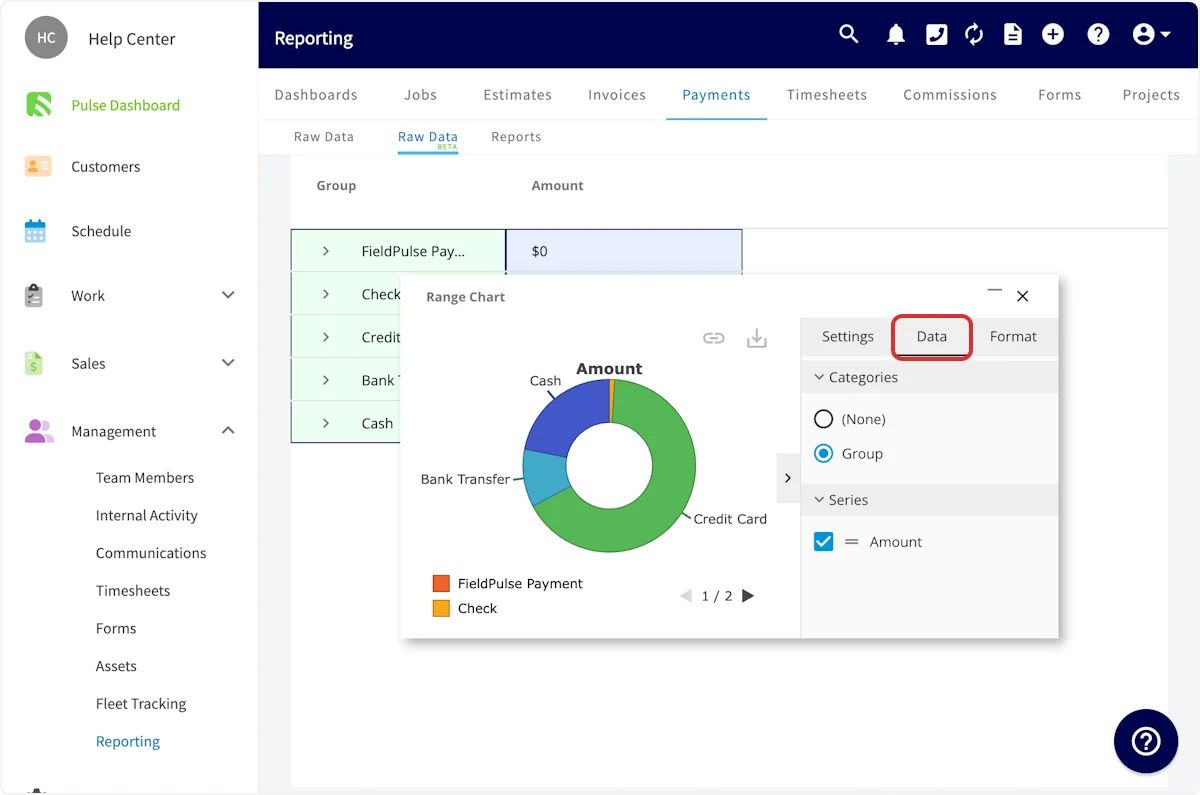
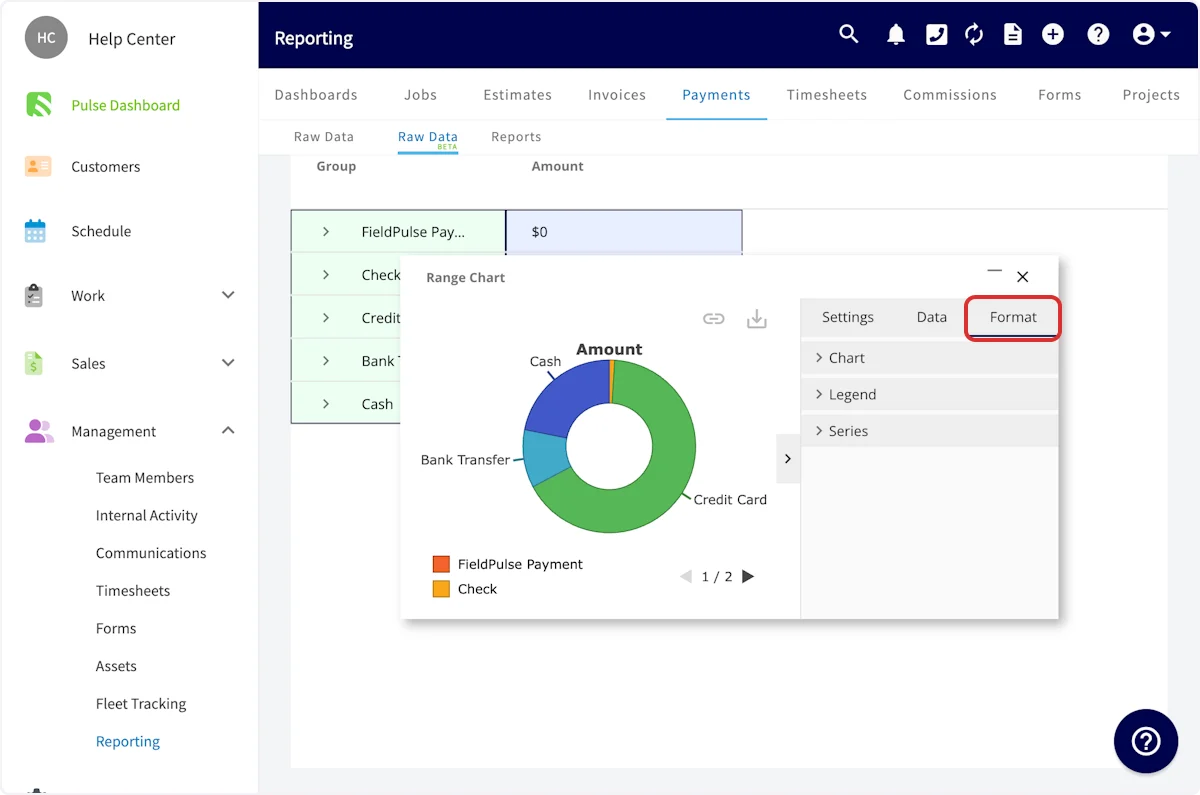
Building Visual Reports
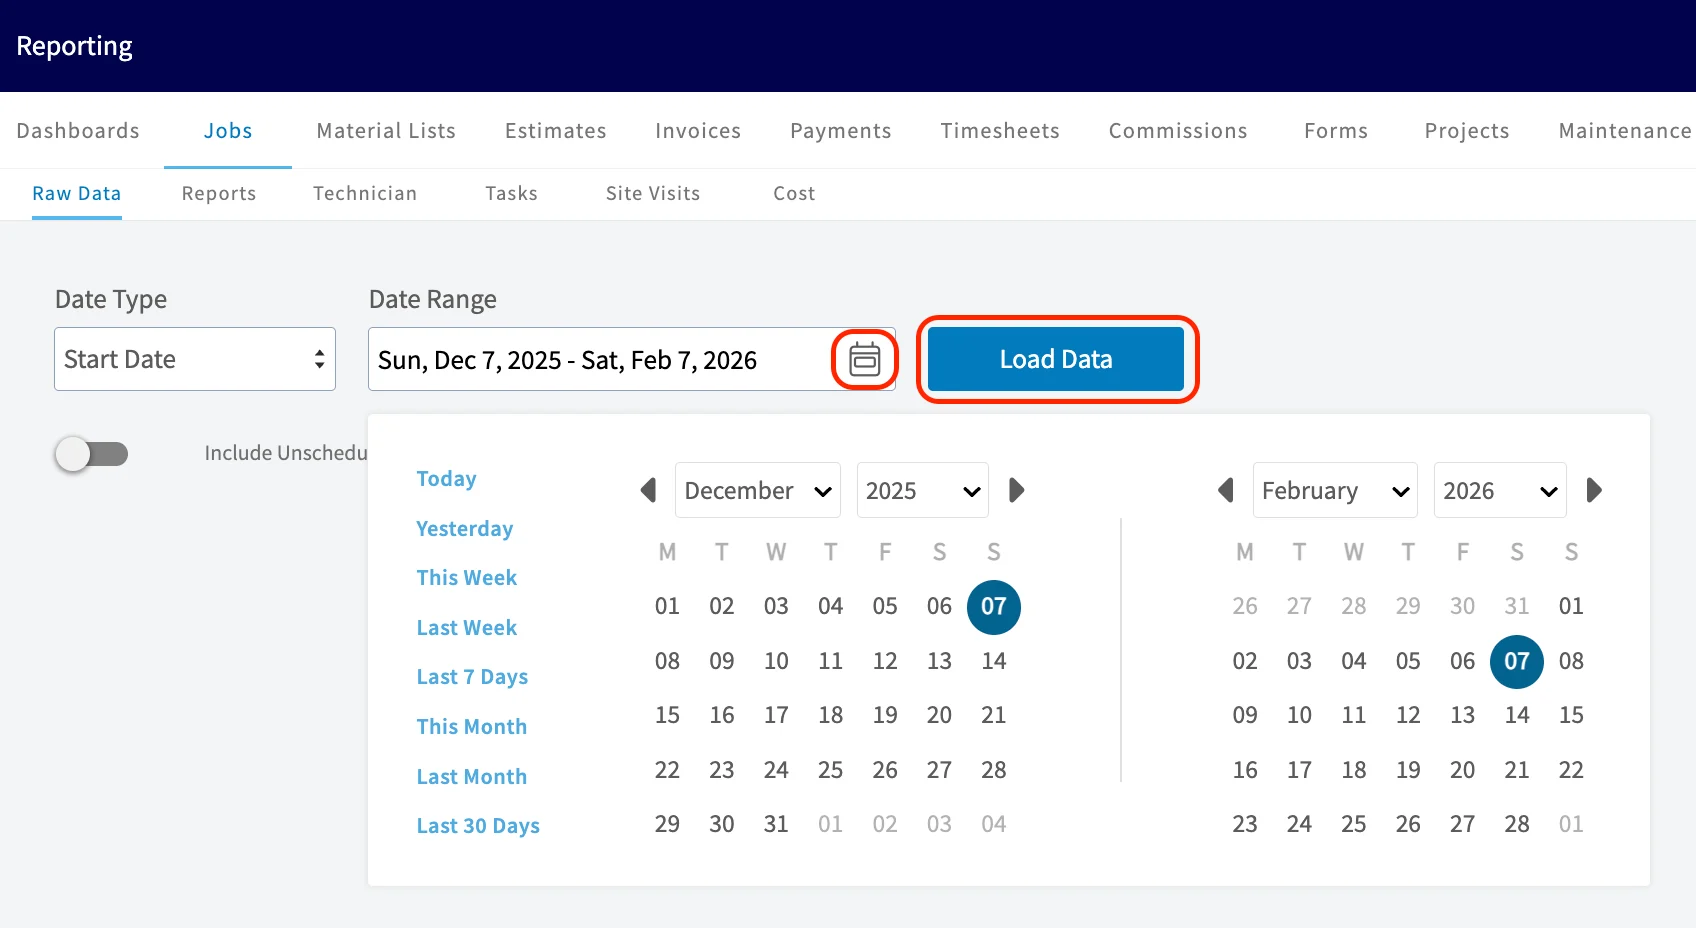
Begin by navigating to Reporting under the Management tab in the left-side menu, then select the record type for which you’d like to generate a report (e.g. Jobs). Select Raw Data Beta. Next, you’ll need to customize your date range. Click on the calendar icon to select your dates, or use the quick service date options to the left of the calendars. Once you’ve selected your dates, click Load Data.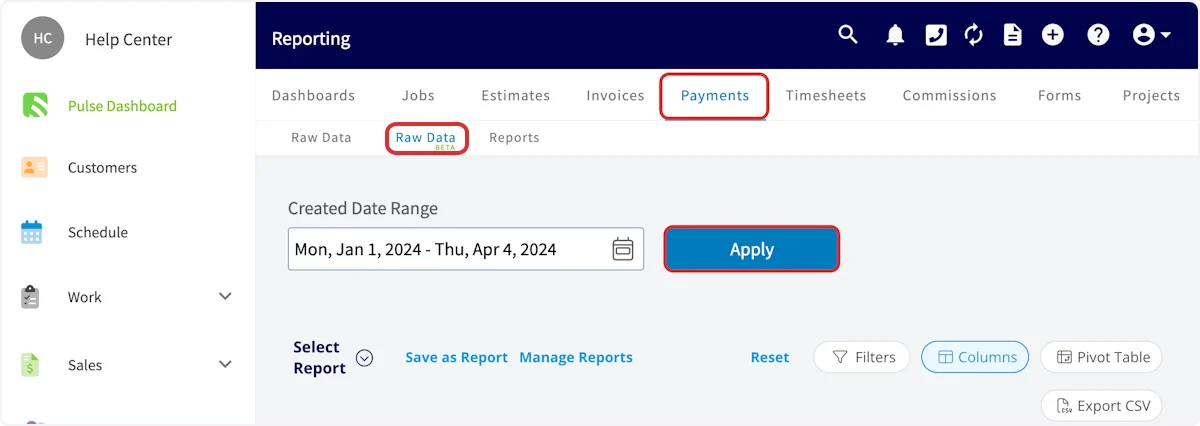
Video Tutorials
Have additional questions? Contact us at support@fieldpulse.com or use the chat feature in the bottom right corner of your screen.